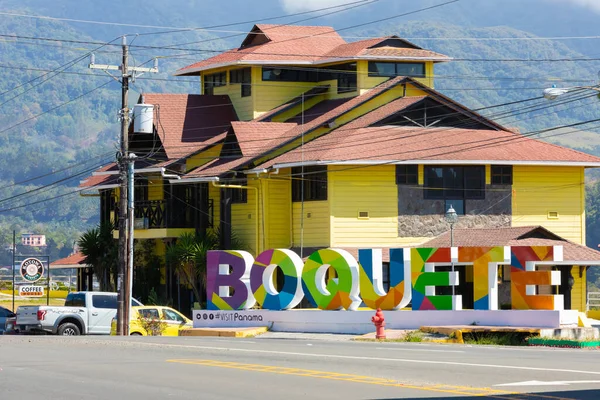
The CEFATI building at the entrance to Bajo Boquete
Panama is diverse in its climate, nature and landscape.
If you like warm weather, the lowlands are good for you, but you'll most likely need air conditioning to stay cool, which brings with it higher energy costs.
The highlands such as Boquete, Volcán or Altos de María offer a cooler climate with temperatures that do not require heating or cooling.
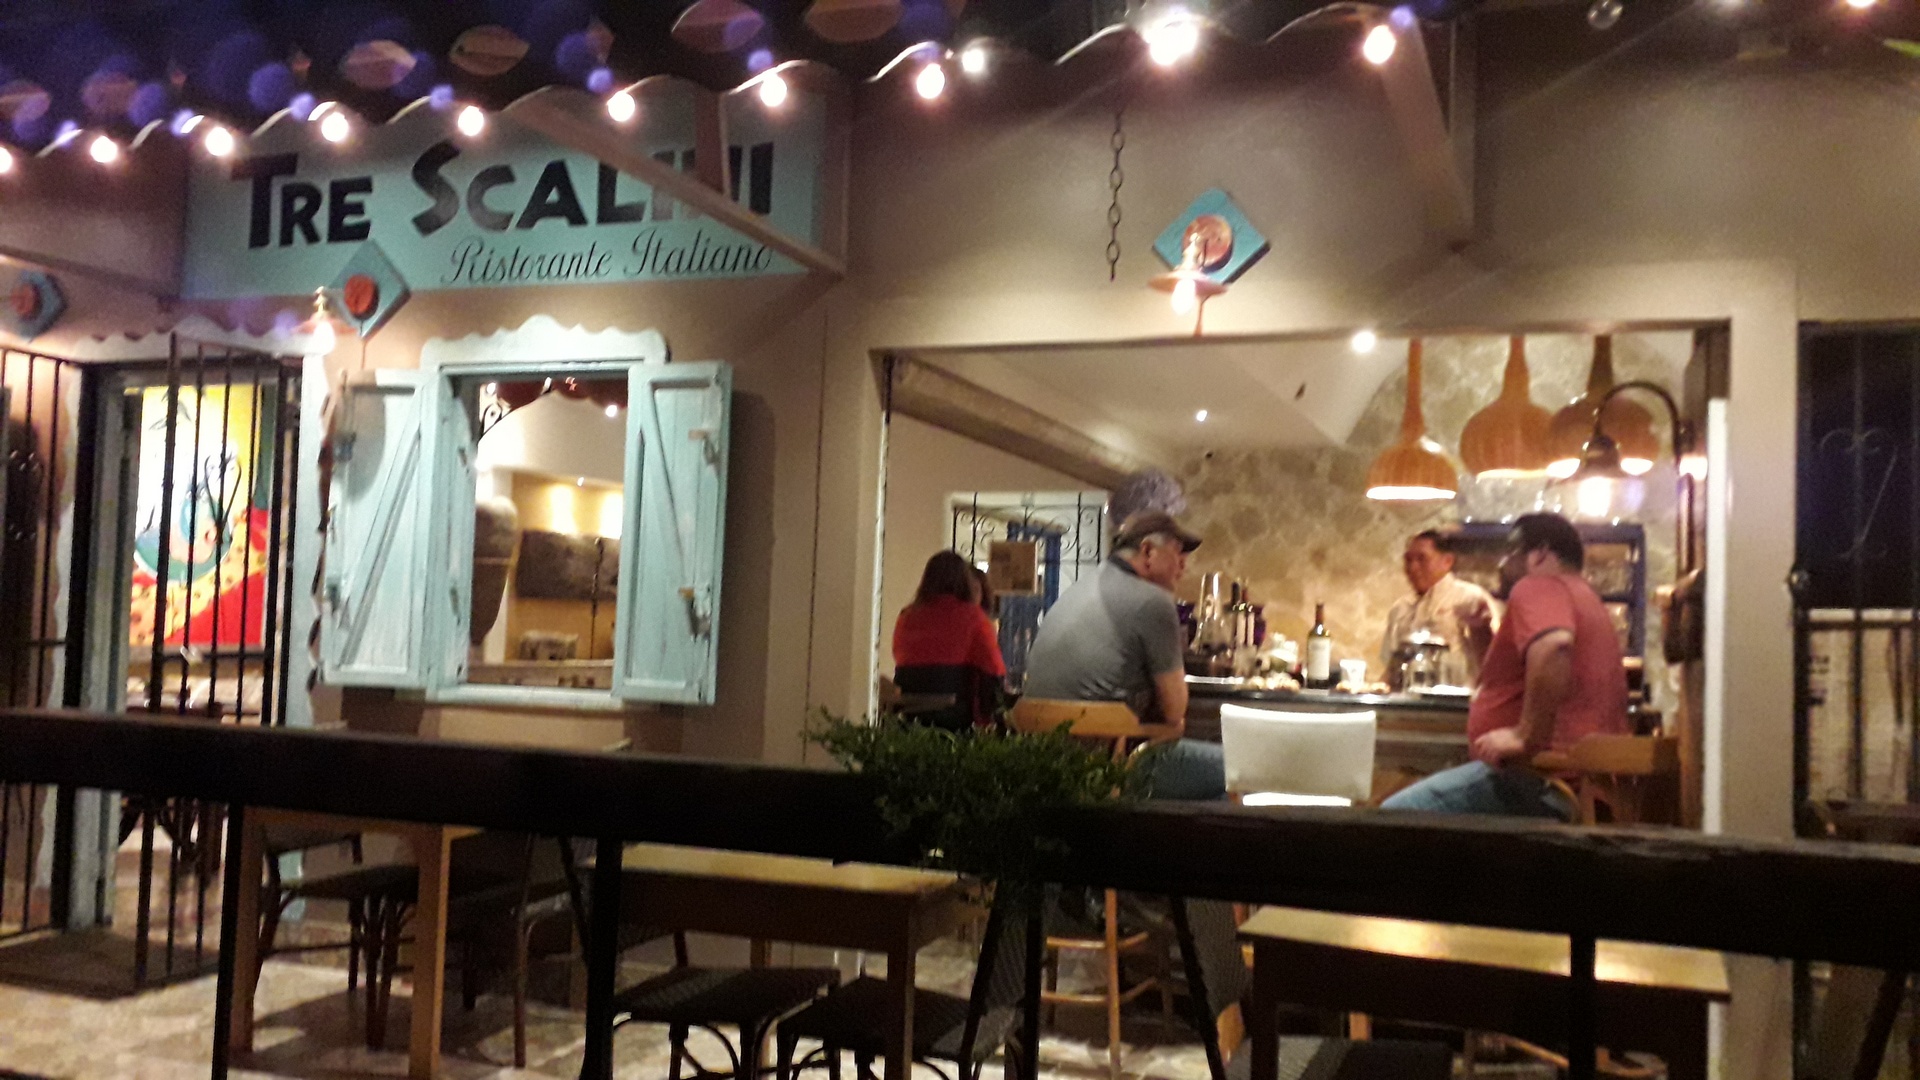
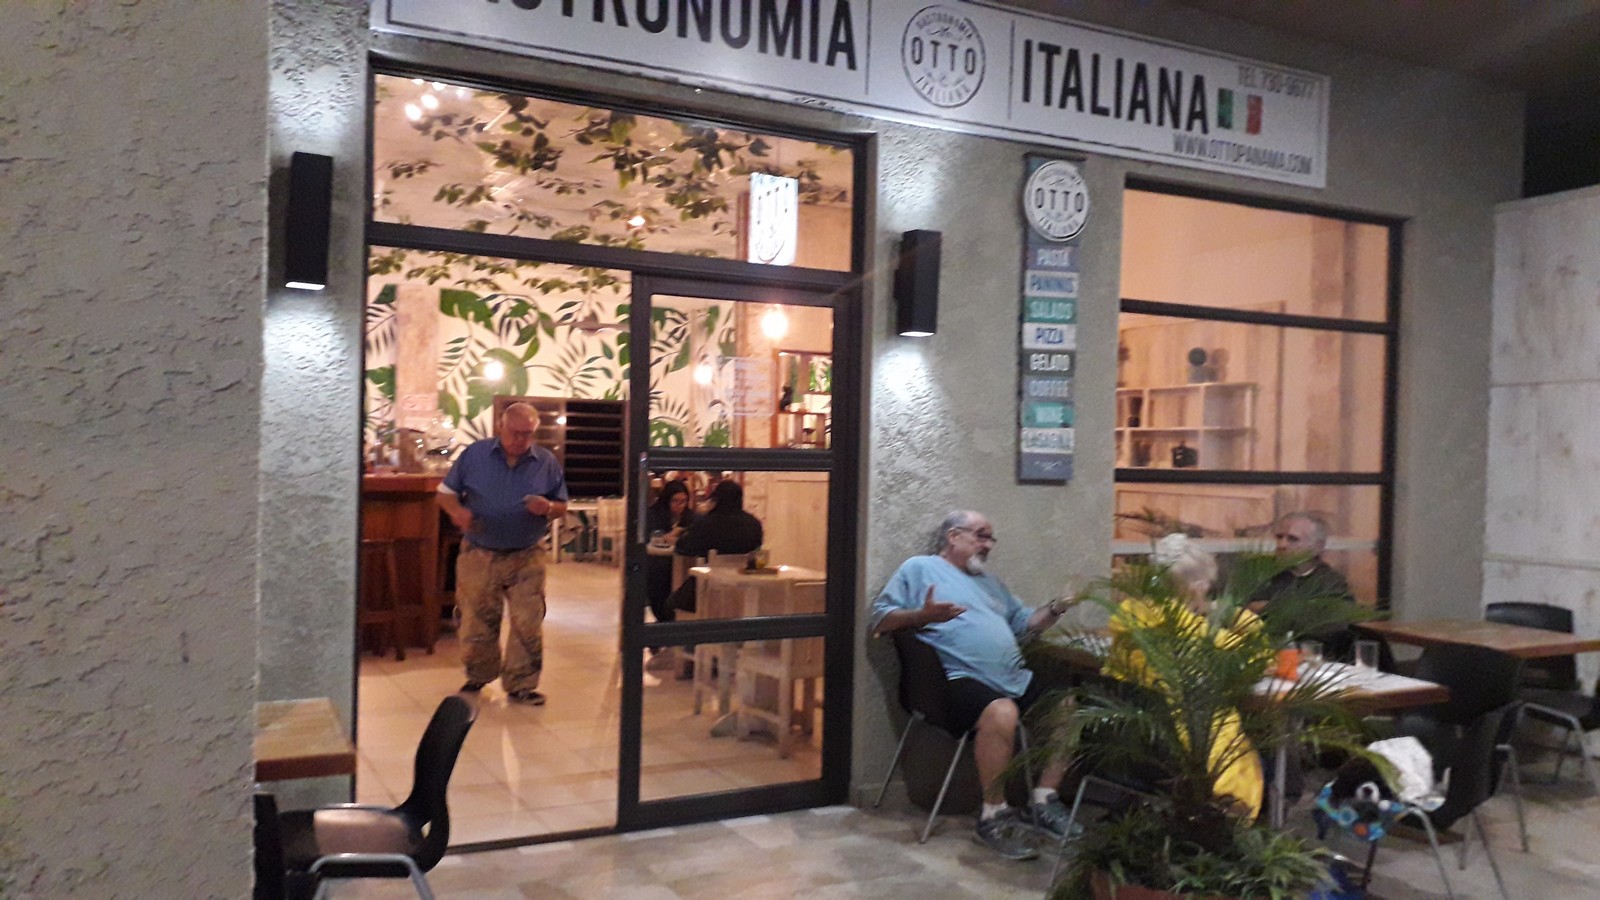
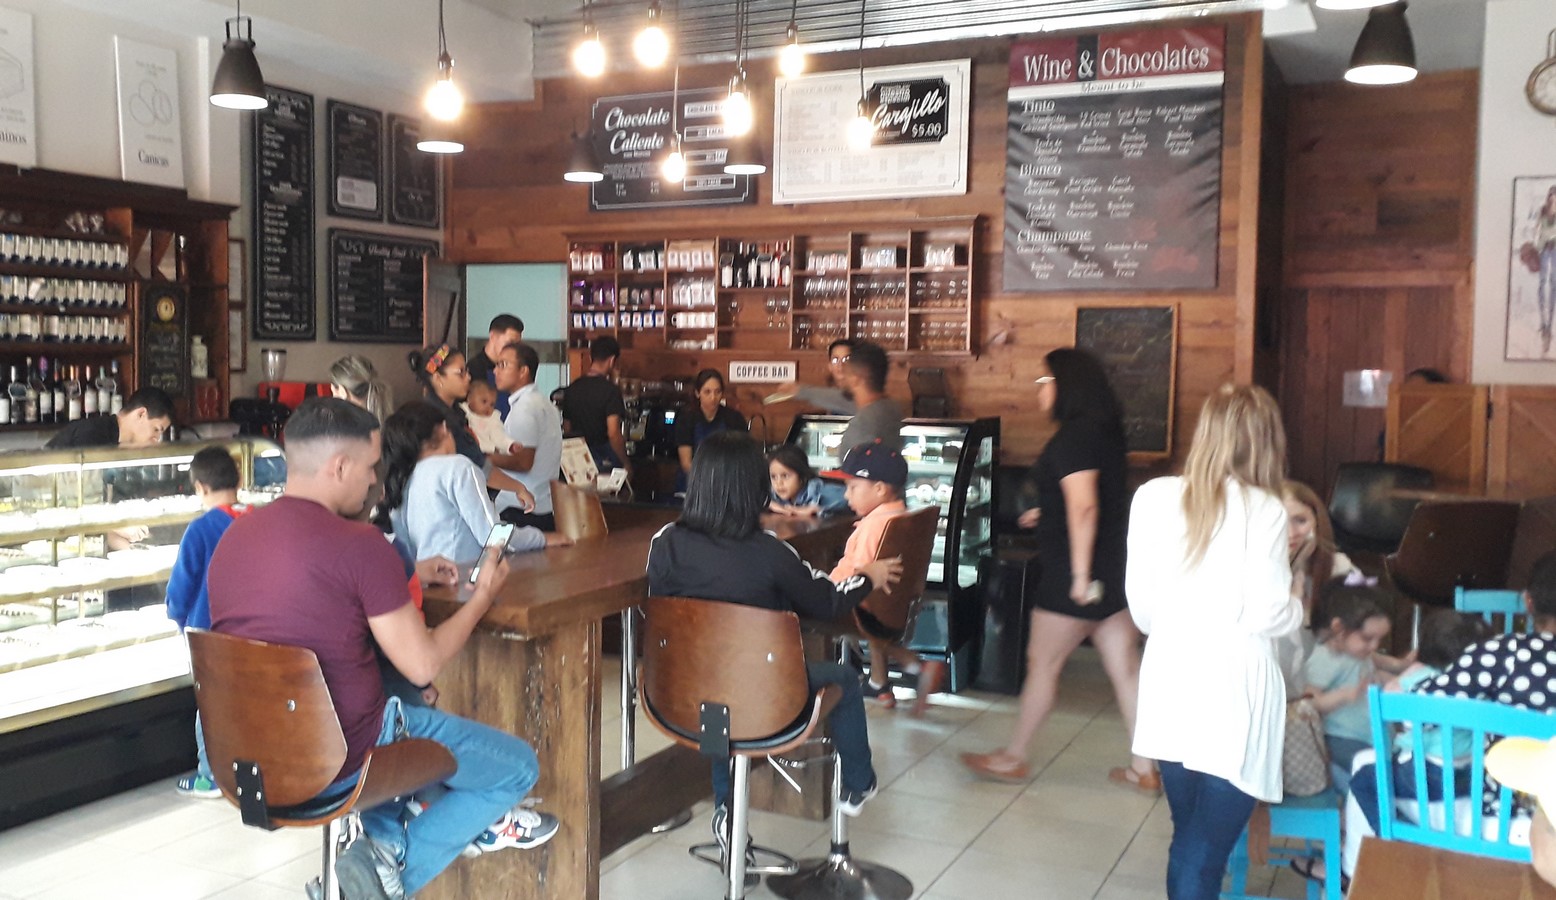
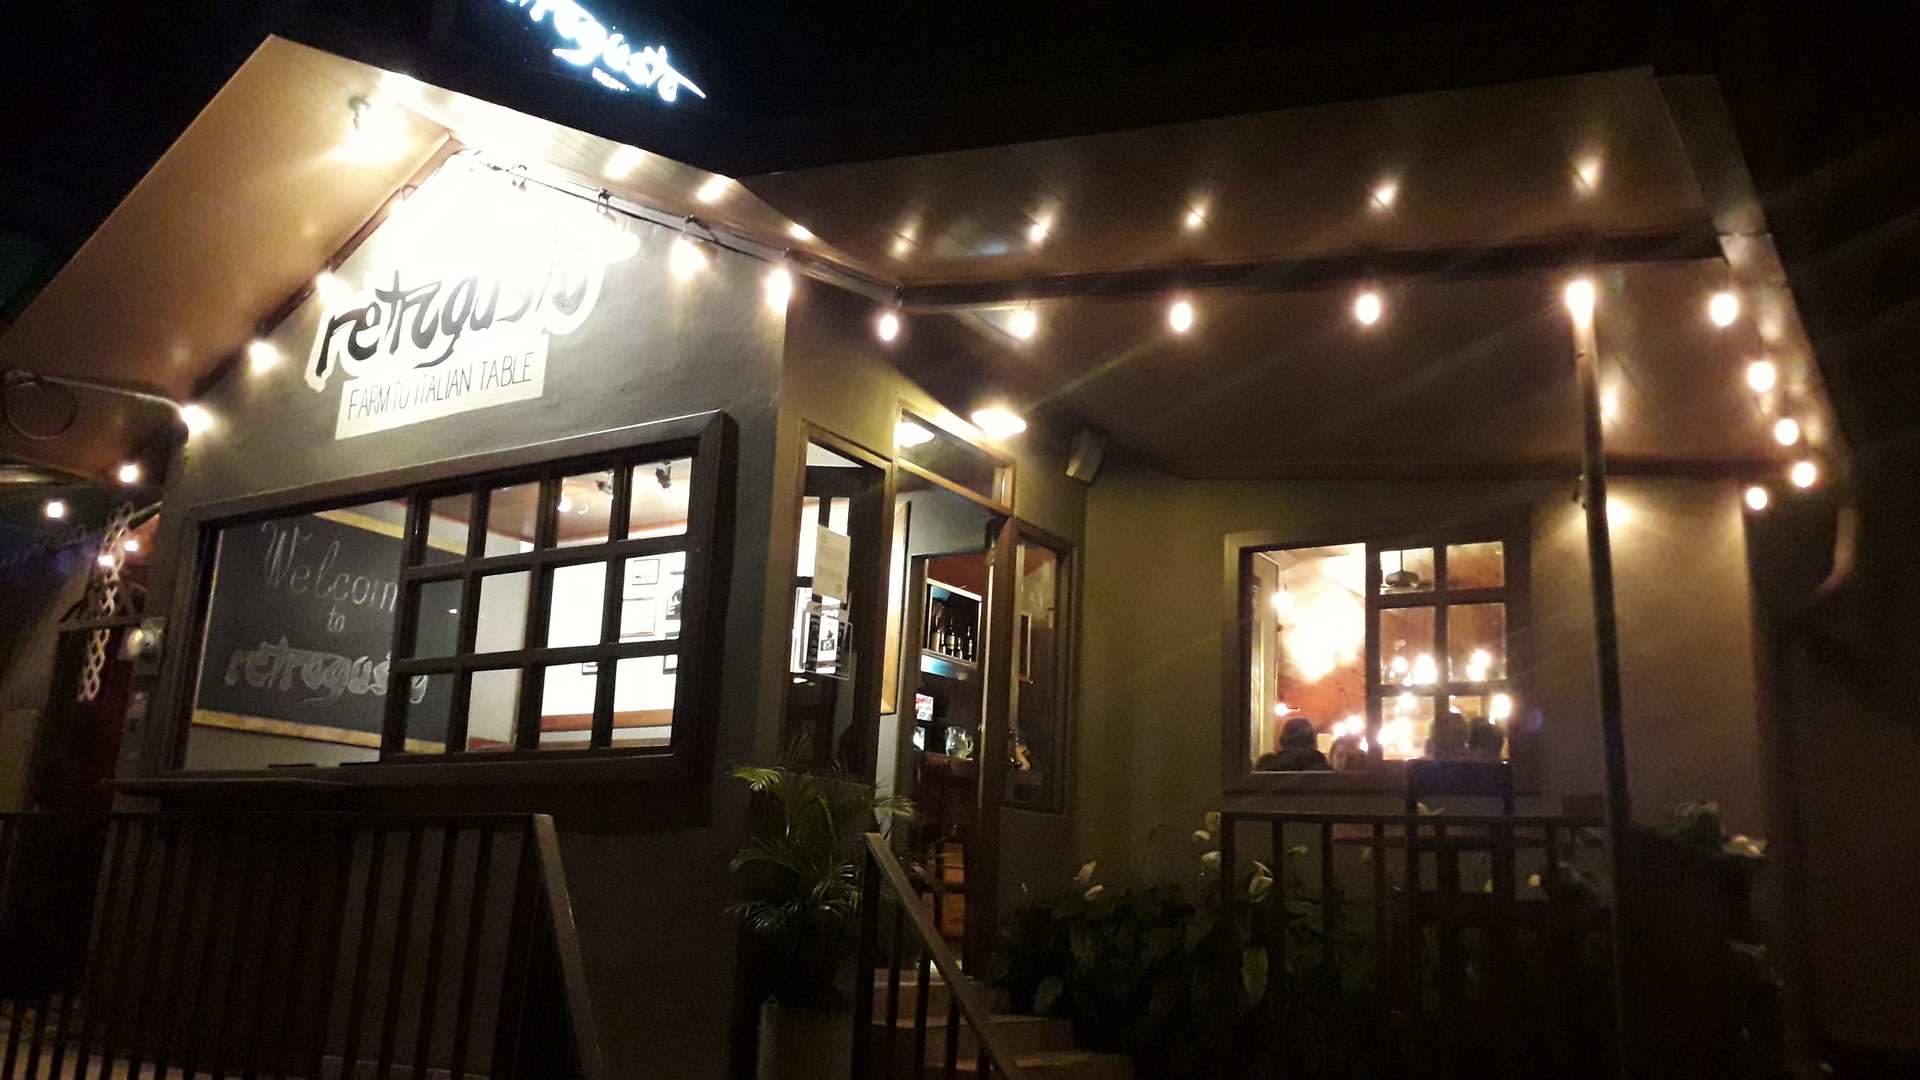
Boquete offers a great mix of spring weather, lush nature, and small-town amenities with lots of international residents and visitors, thus plenty of good restaurants and decent places to shop.
Boquete, located in the western
highlands of Panama, is a popular tourist destination for several reasons. Here
are some of the main attractions and reasons why people visit Boquete:
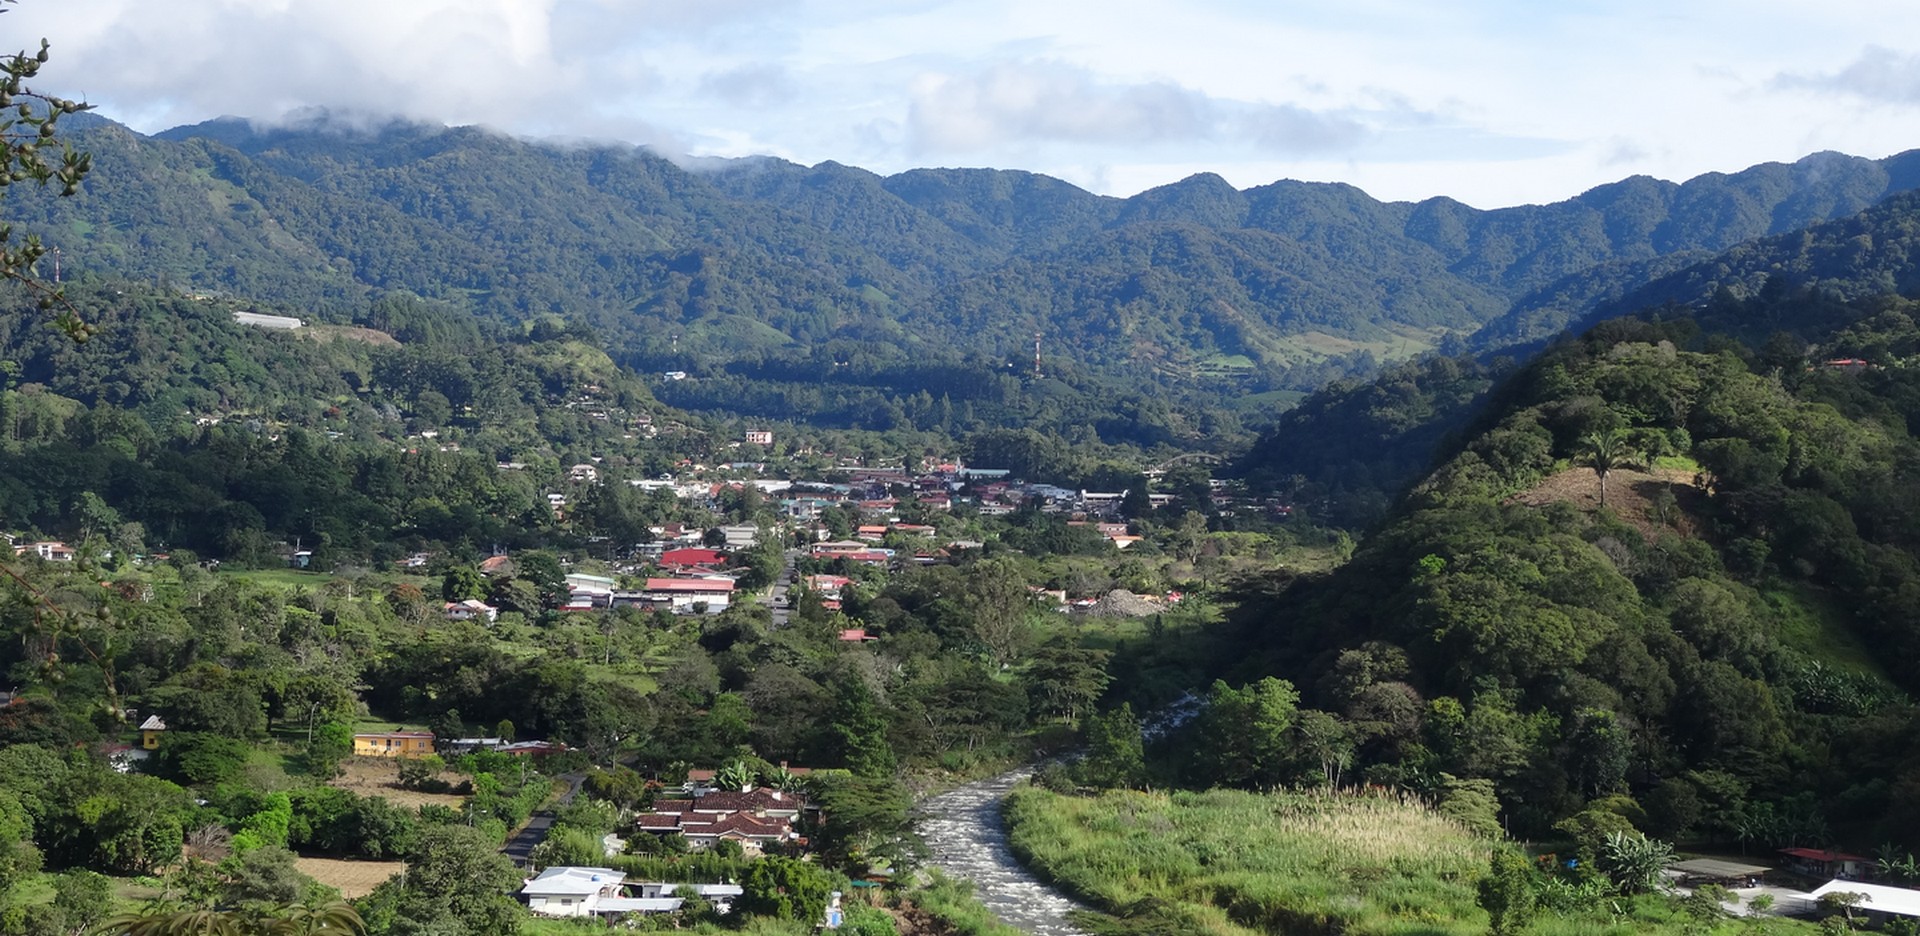
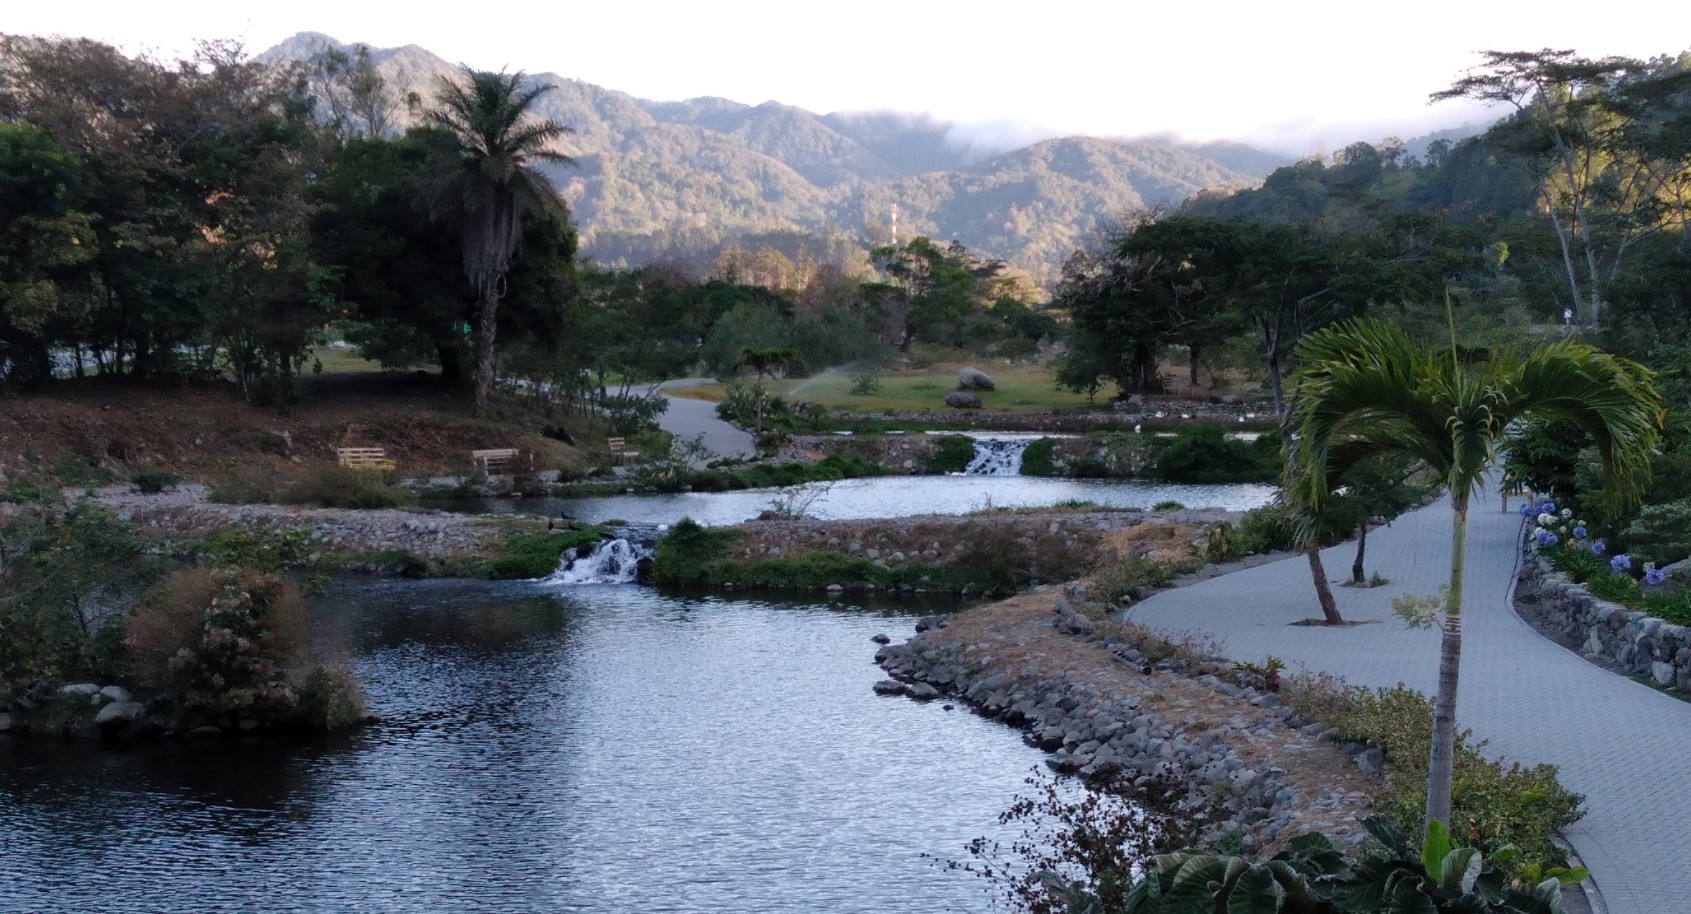
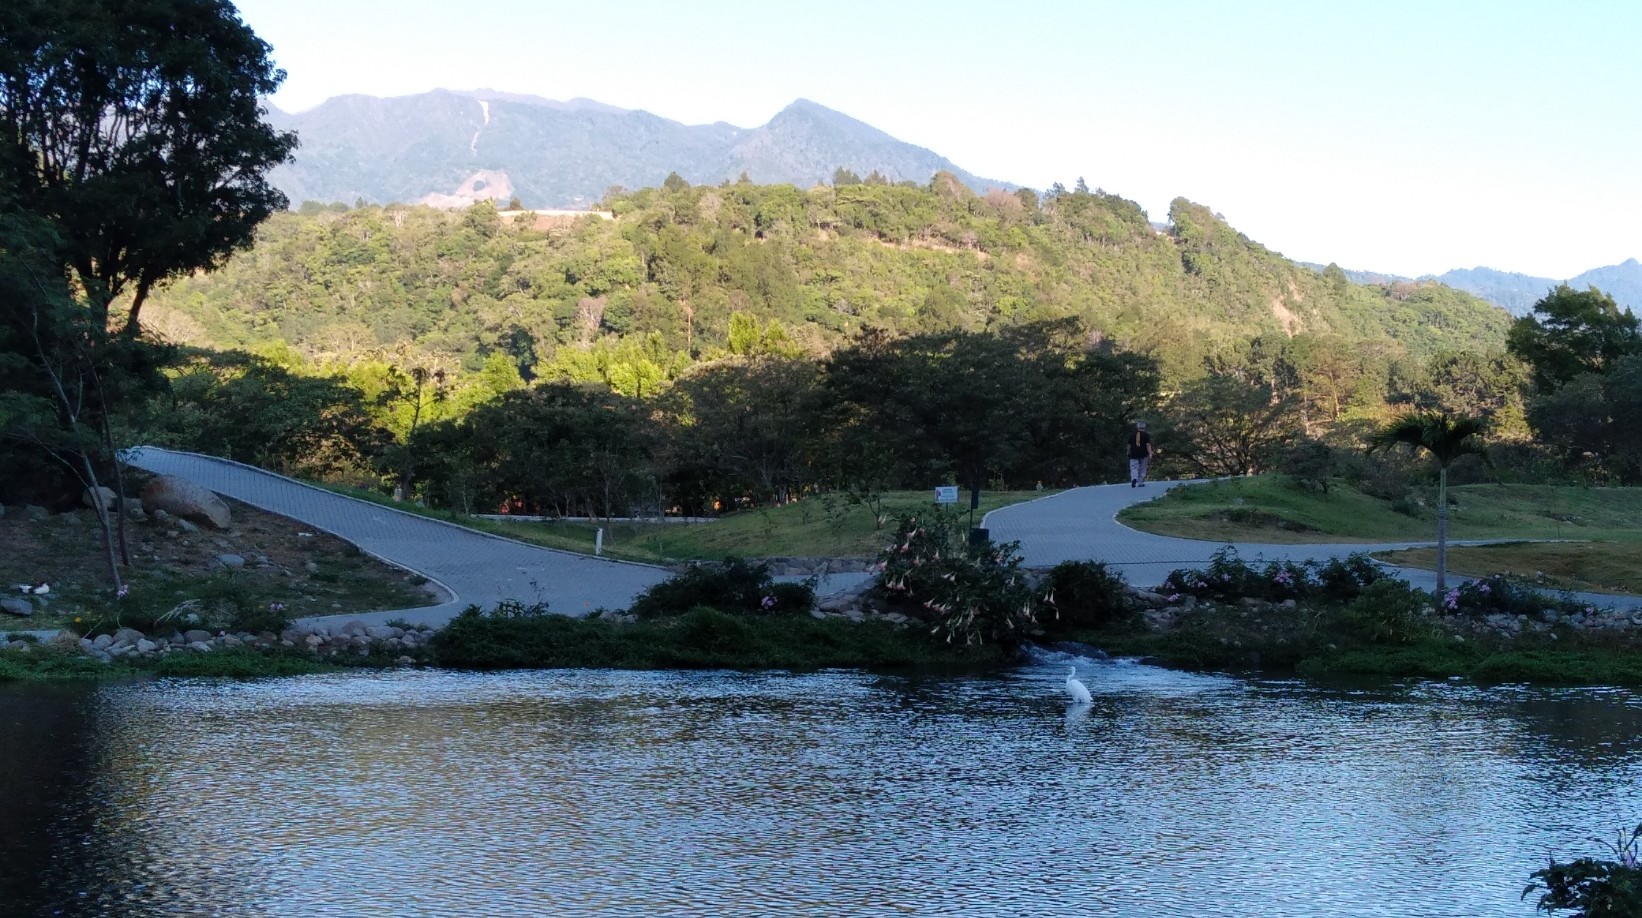
1. Stunning Natural Beauty: Boquete is
nestled in the lush mountains of the Chiriquí Highlands, offering breathtaking
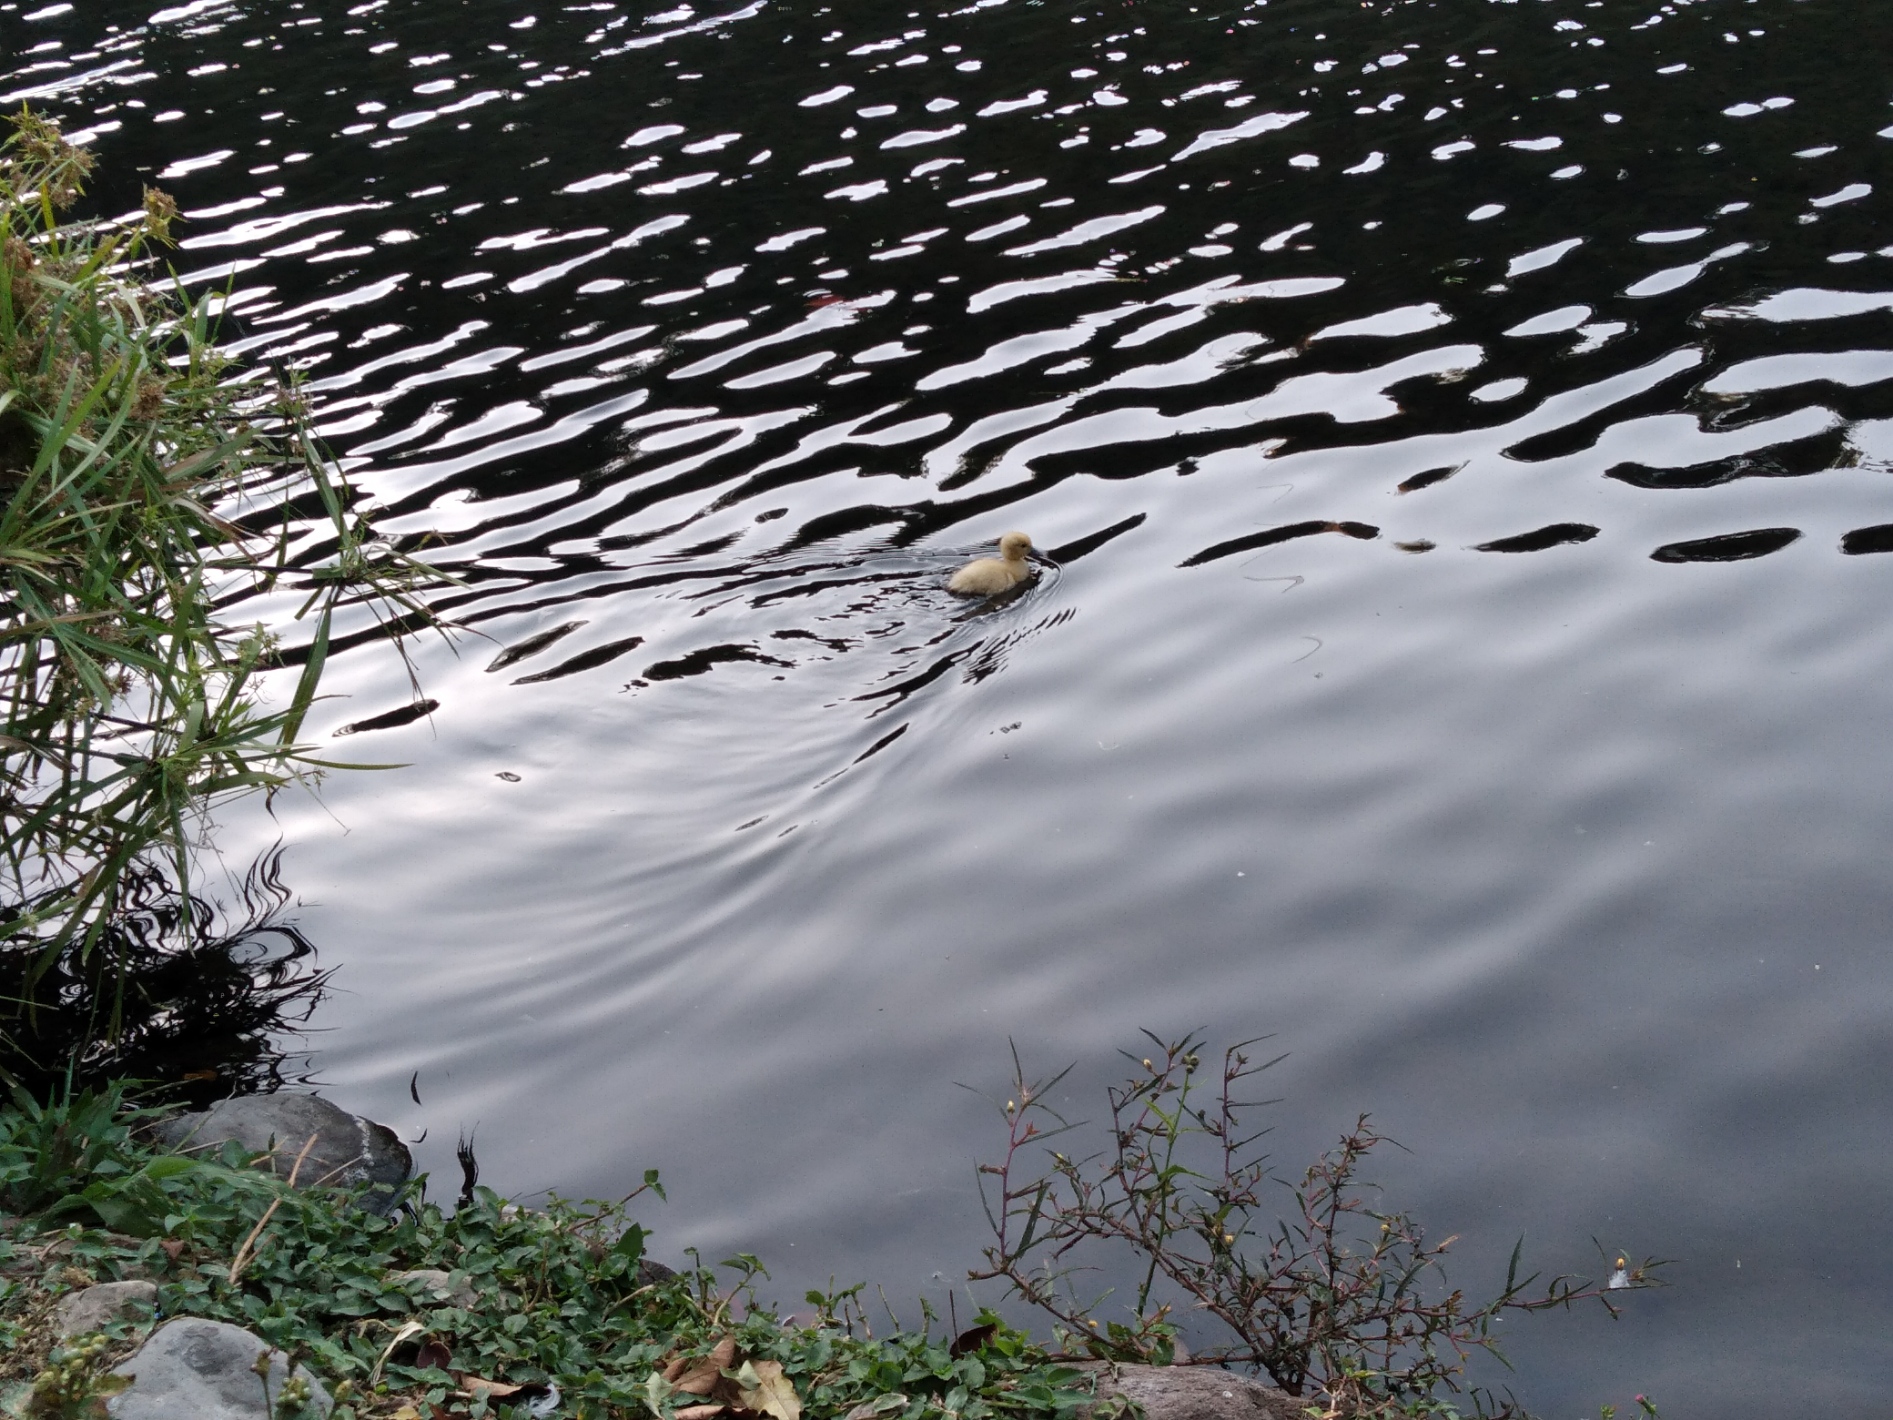
natural scenery. It is surrounded by cloud forests, rivers, waterfalls, and
picturesque landscapes. The area is known for its vibrant flora and fauna,
making it a paradise for nature lovers and outdoor enthusiasts.
2. Pleasant Climate: Boquete enjoys a
mild and pleasant climate throughout the year due to its high elevation. The
cool temperatures and lower humidity create an ideal environment, especially
for those seeking relief from hot tropical weather. The comfortable climate
also contributes to the cultivation of high-quality coffee, for which Boquete
is famous.
3. Coffee Tourism: Boquete is renowned
for its coffee production, particularly the Geisha coffee variety, considered
one of the best in the world. Coffee enthusiasts can visit coffee farms,
participate in tours, and learn about the coffee-making process from bean to
cup. It's an opportunity to appreciate the art of coffee production and indulge
in exquisite flavors.
4. Adventure and Outdoor Activities:
Boquete is an adventure playground with numerous activities to satisfy
thrill-seekers. From hiking and trekking in the cloud forests of Volcán Barú
National Park to white-water rafting in the Chiriquí Viejo River, there are
options for every adventure level. Zip-lining, rock climbing, birdwatching, and
exploring hot springs are also popular activities.
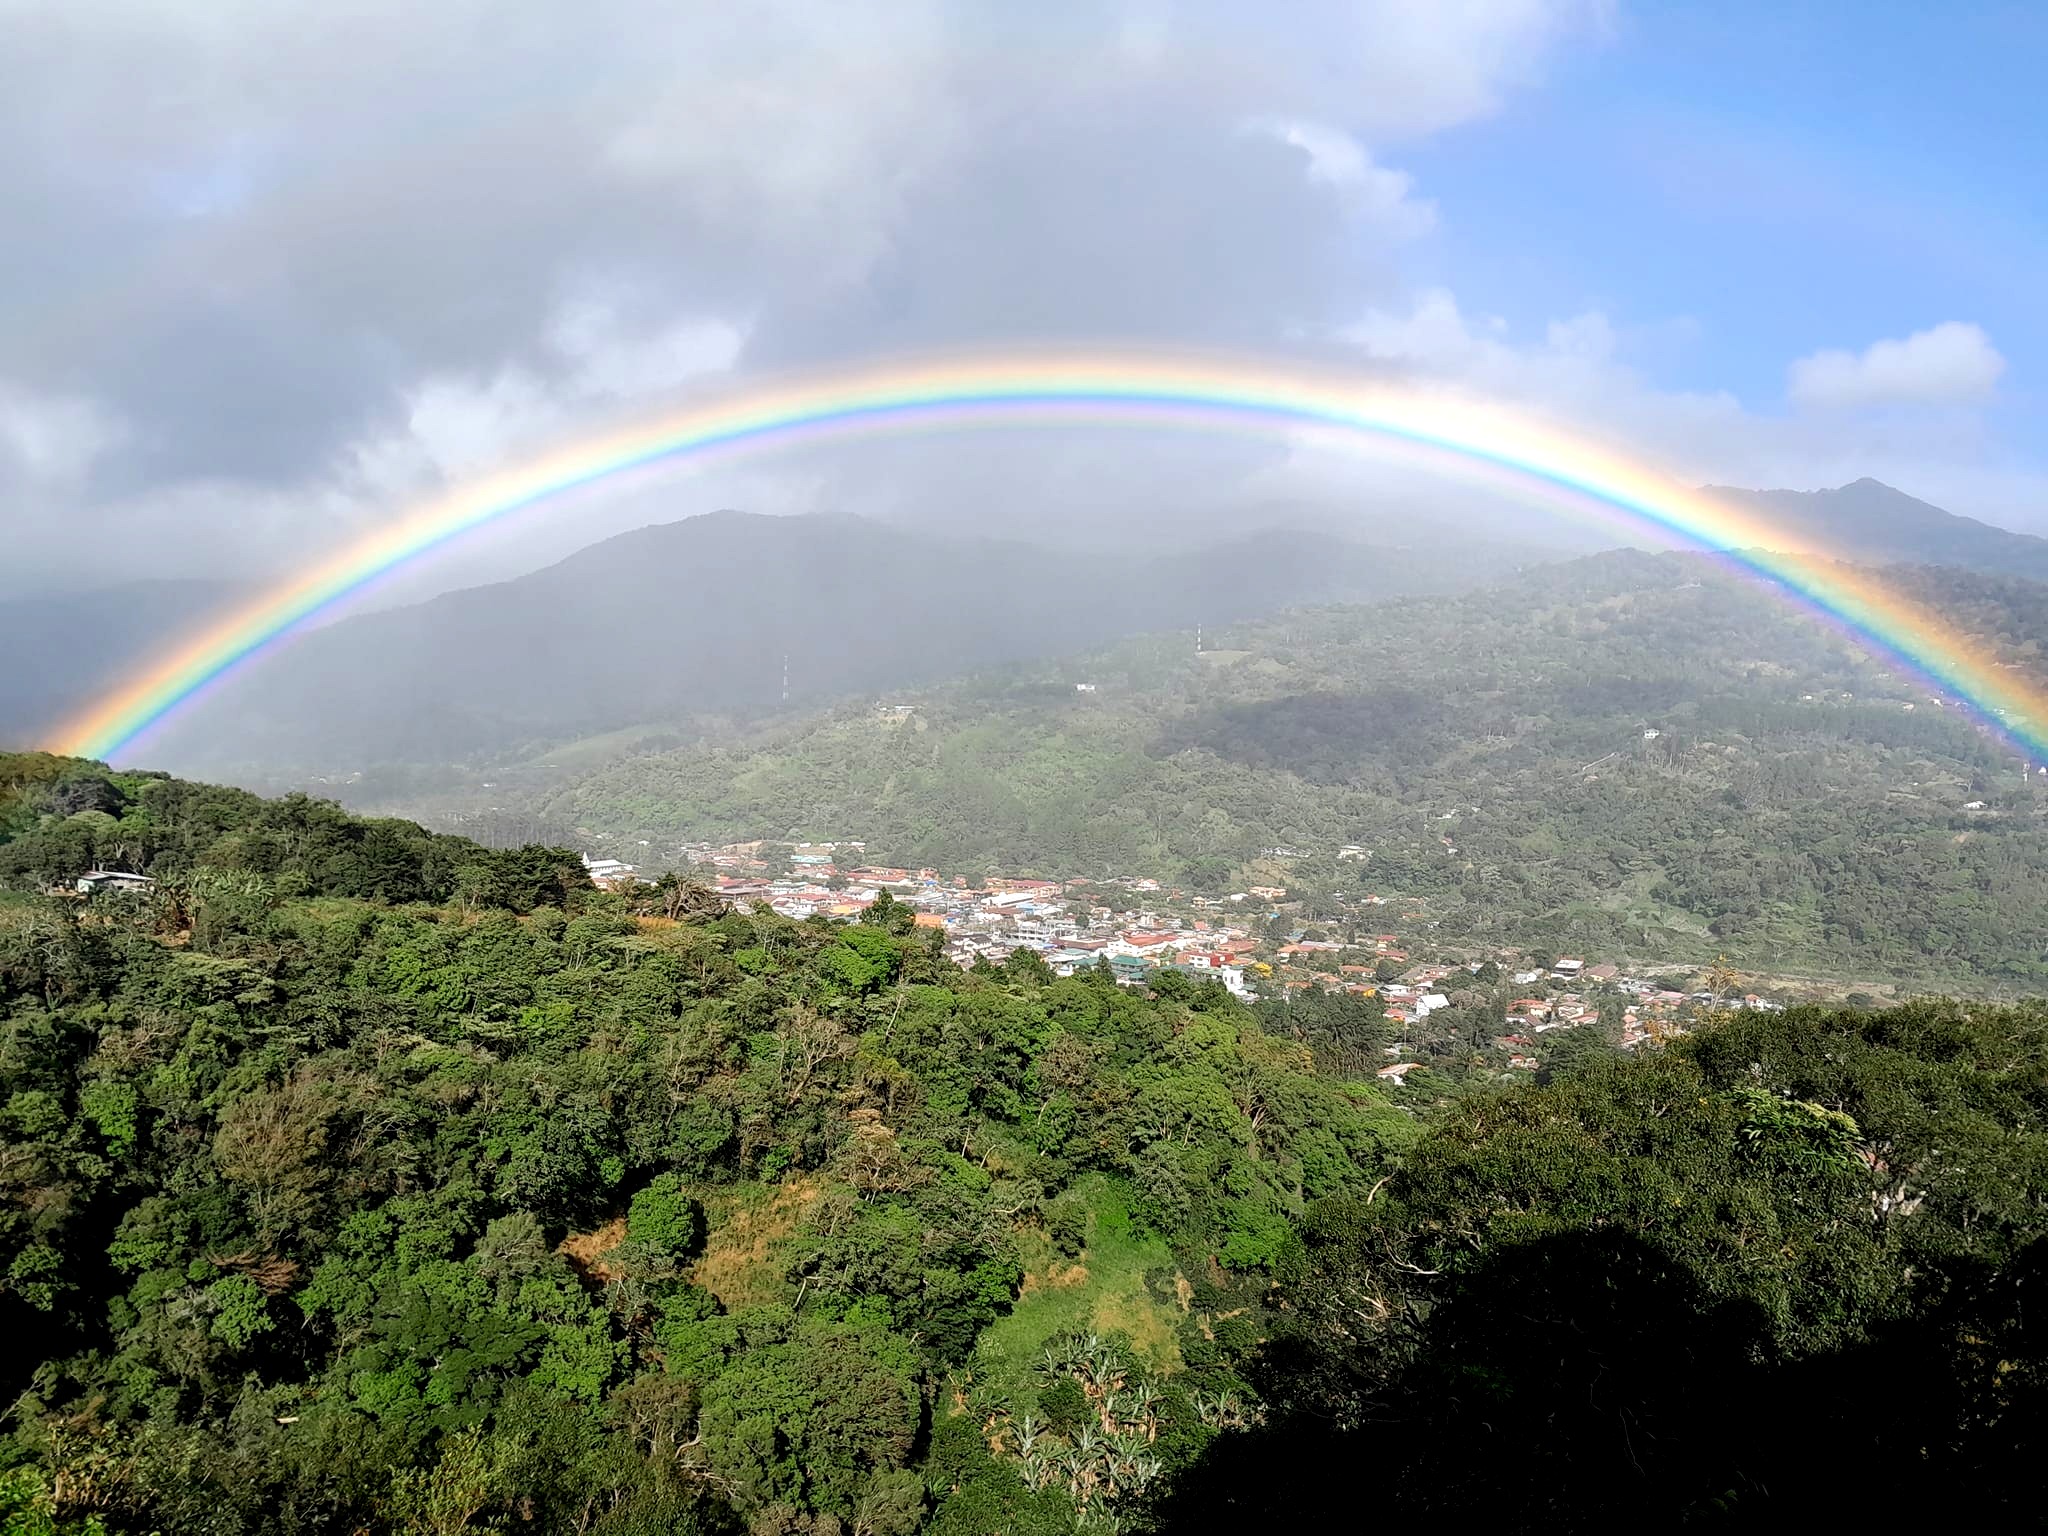
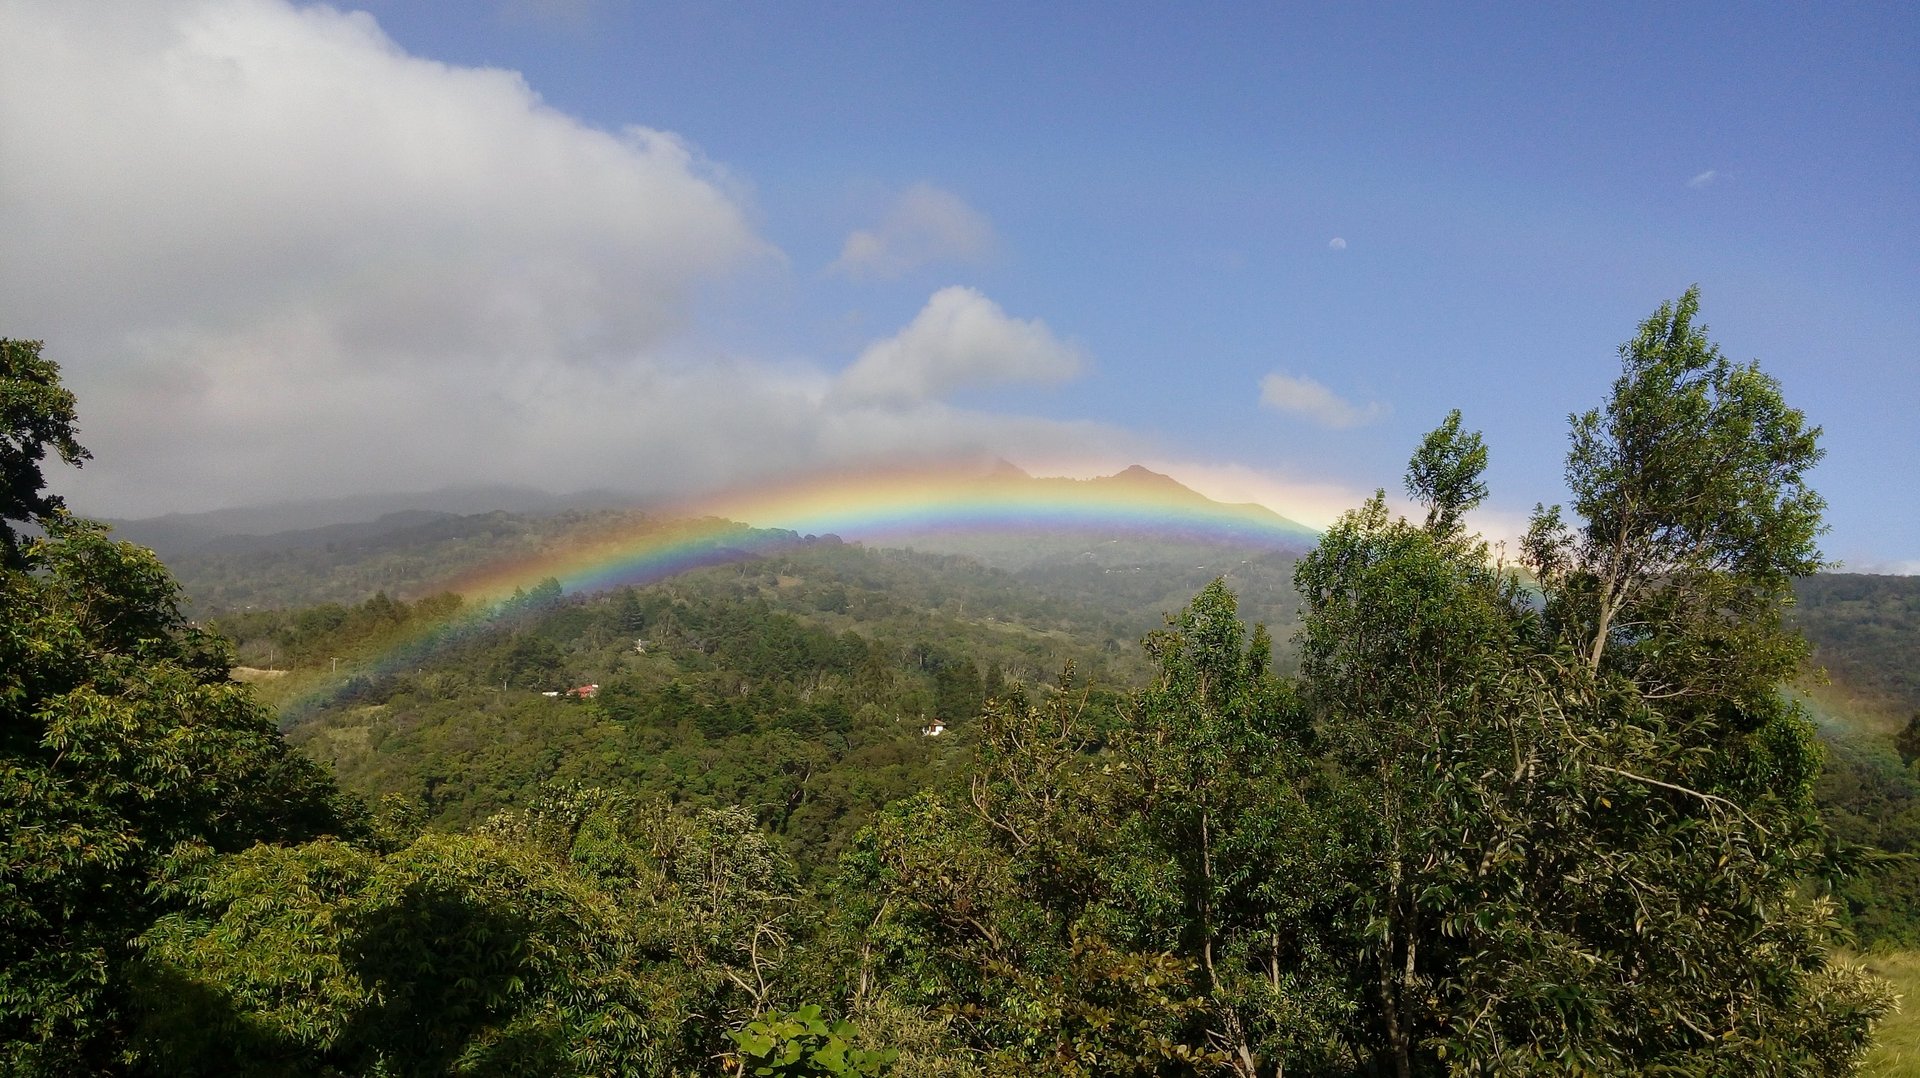
A rainbow over the hills of Boquete
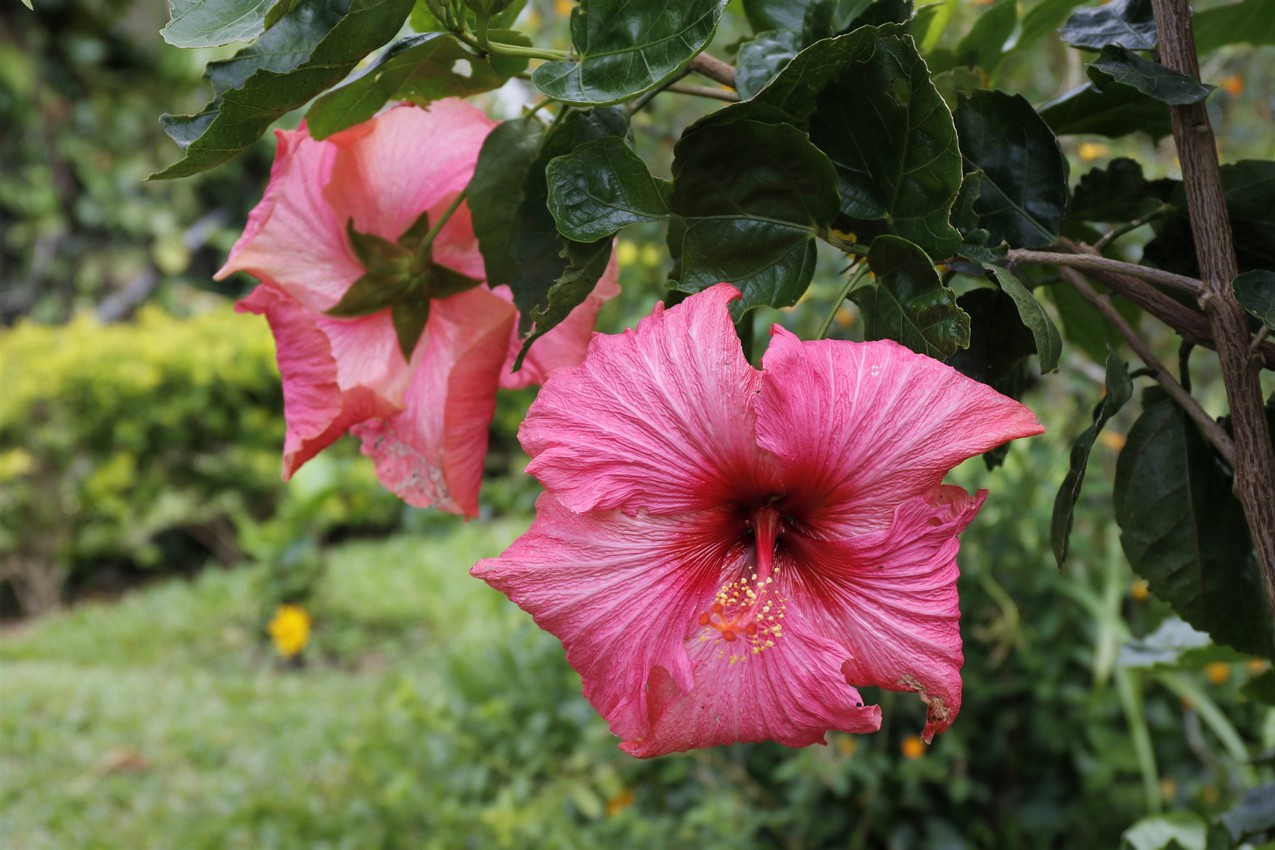
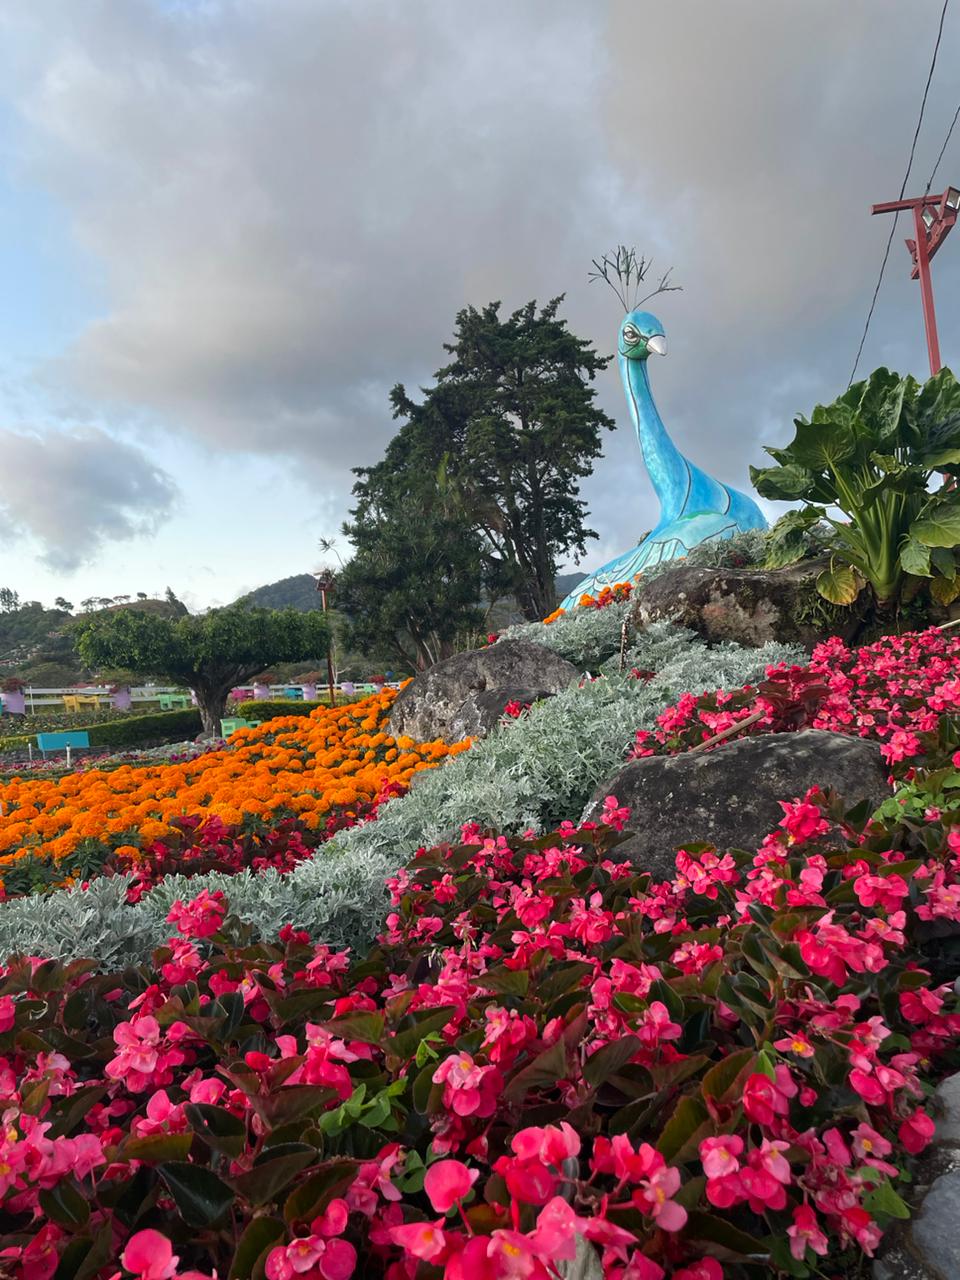
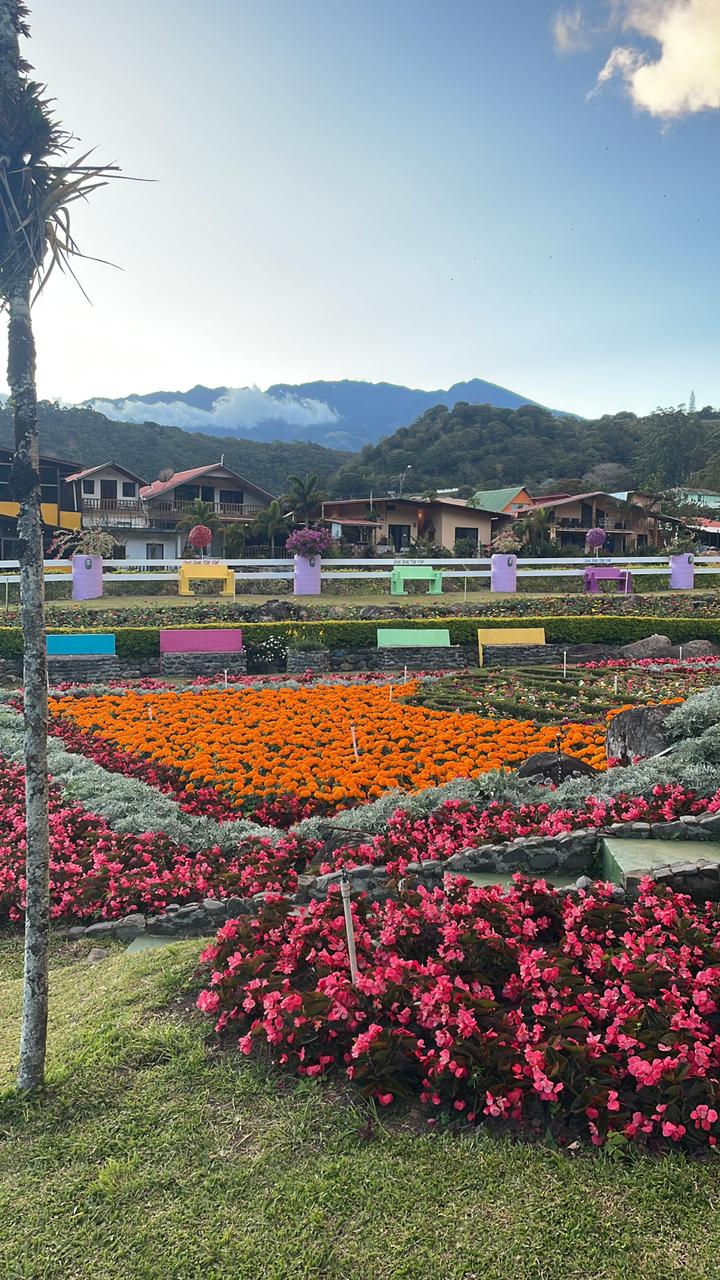
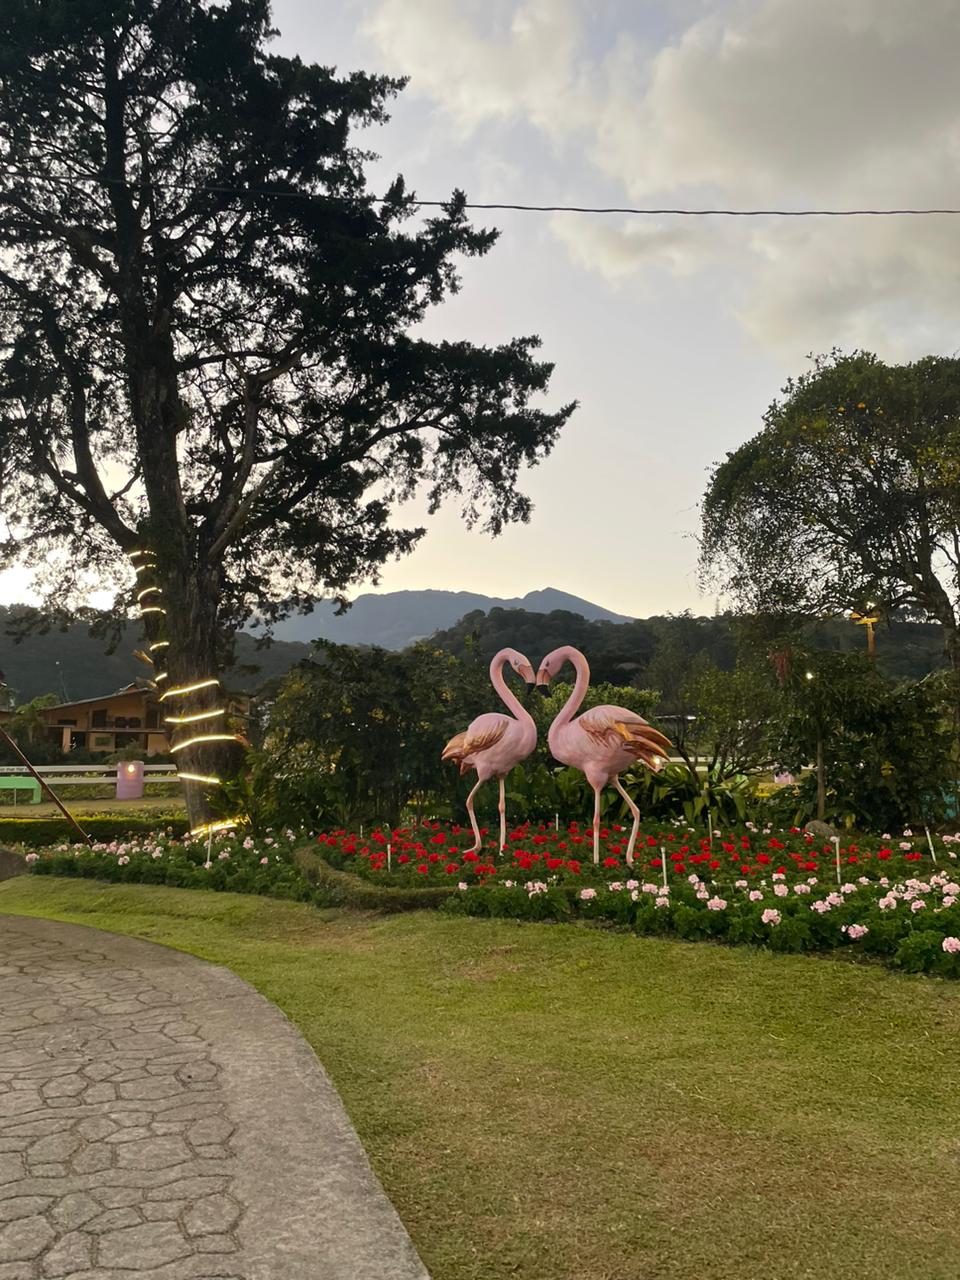
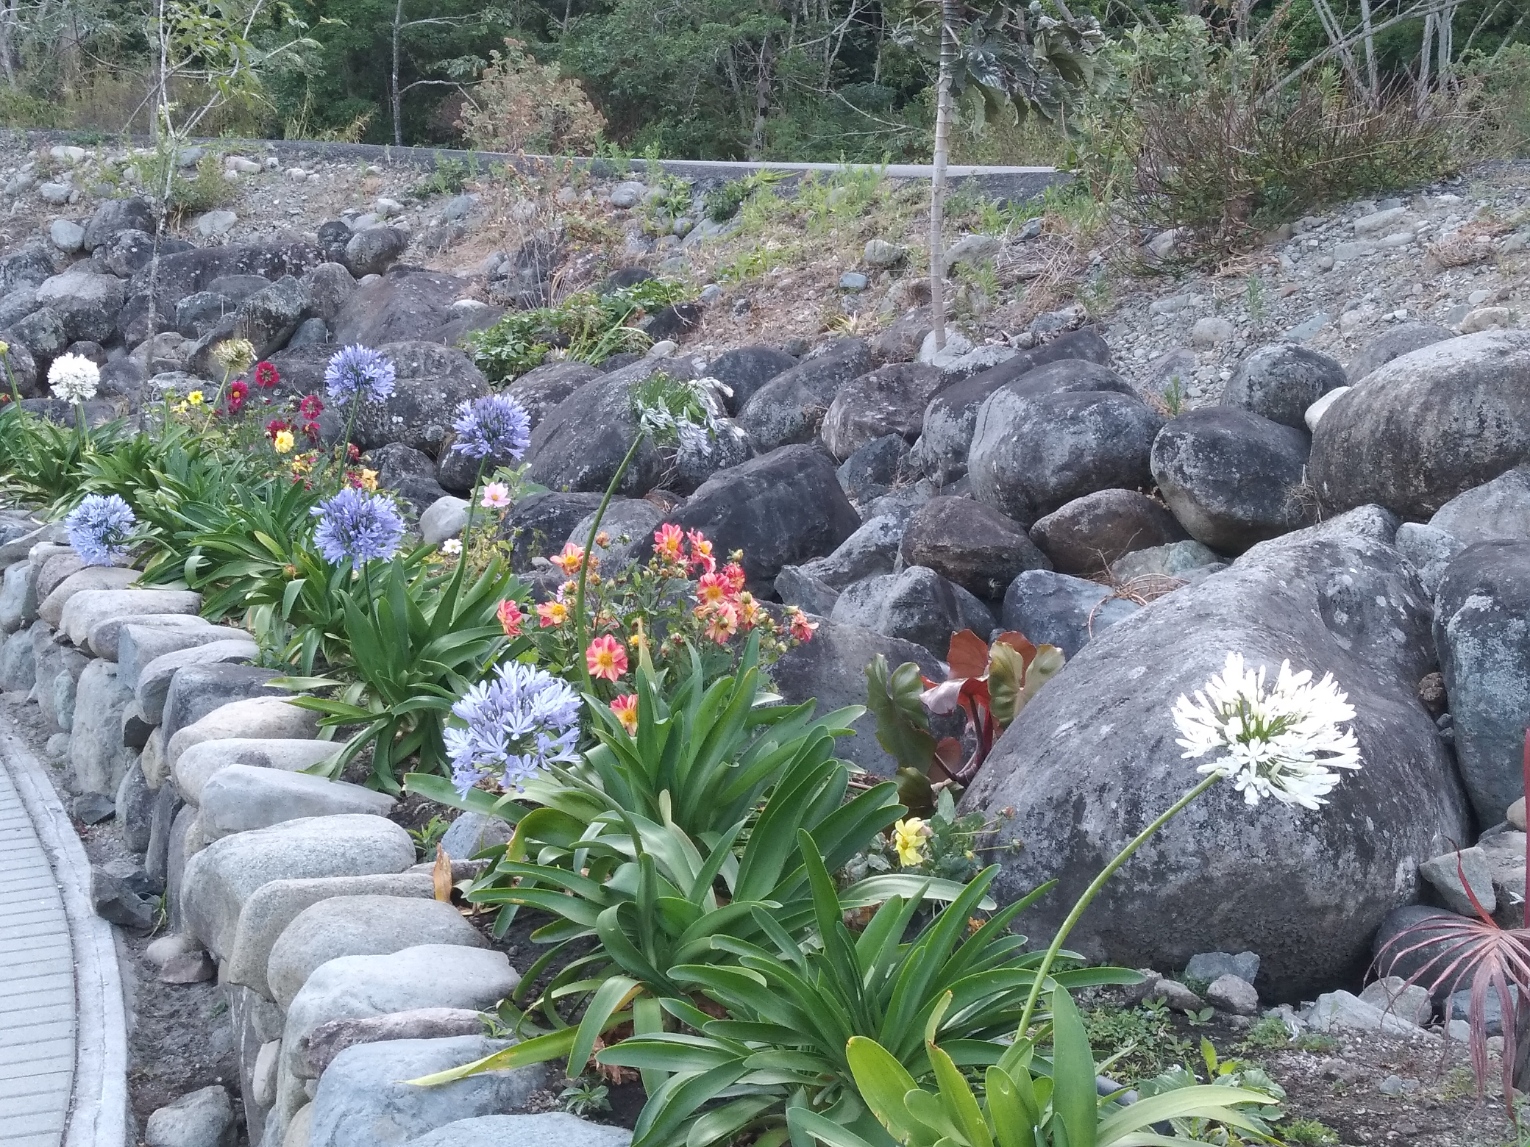
5. Flower and Orchid Gardens: Boquete
is home to a wide array of colorful flowers and orchids. The cool climate
provides an ideal environment for these delicate blooms to flourish. Visitors
can explore various gardens and nurseries to appreciate the stunning floral
displays, including the famous annual Boquete Flower and Coffee Festival.
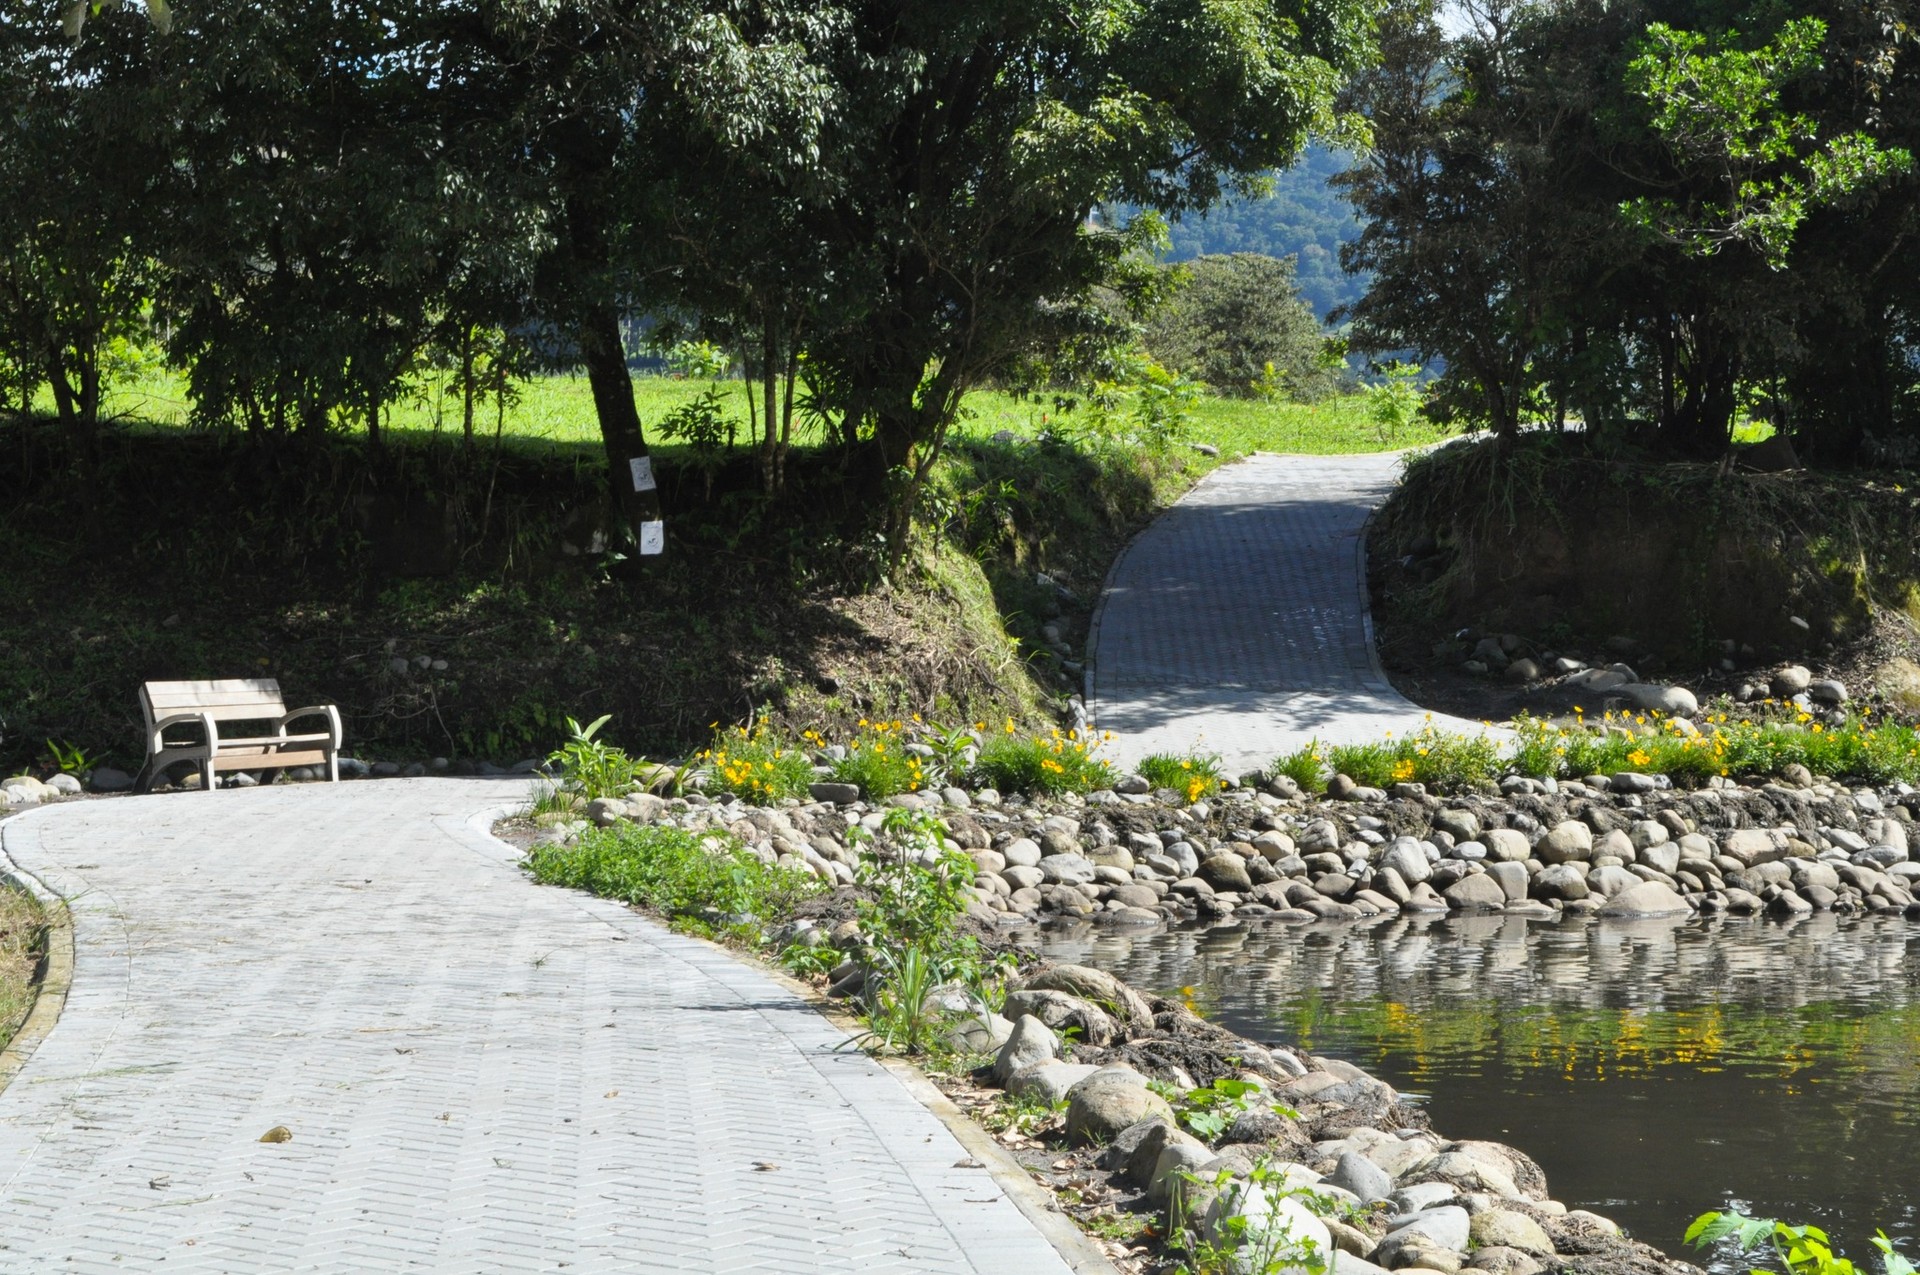
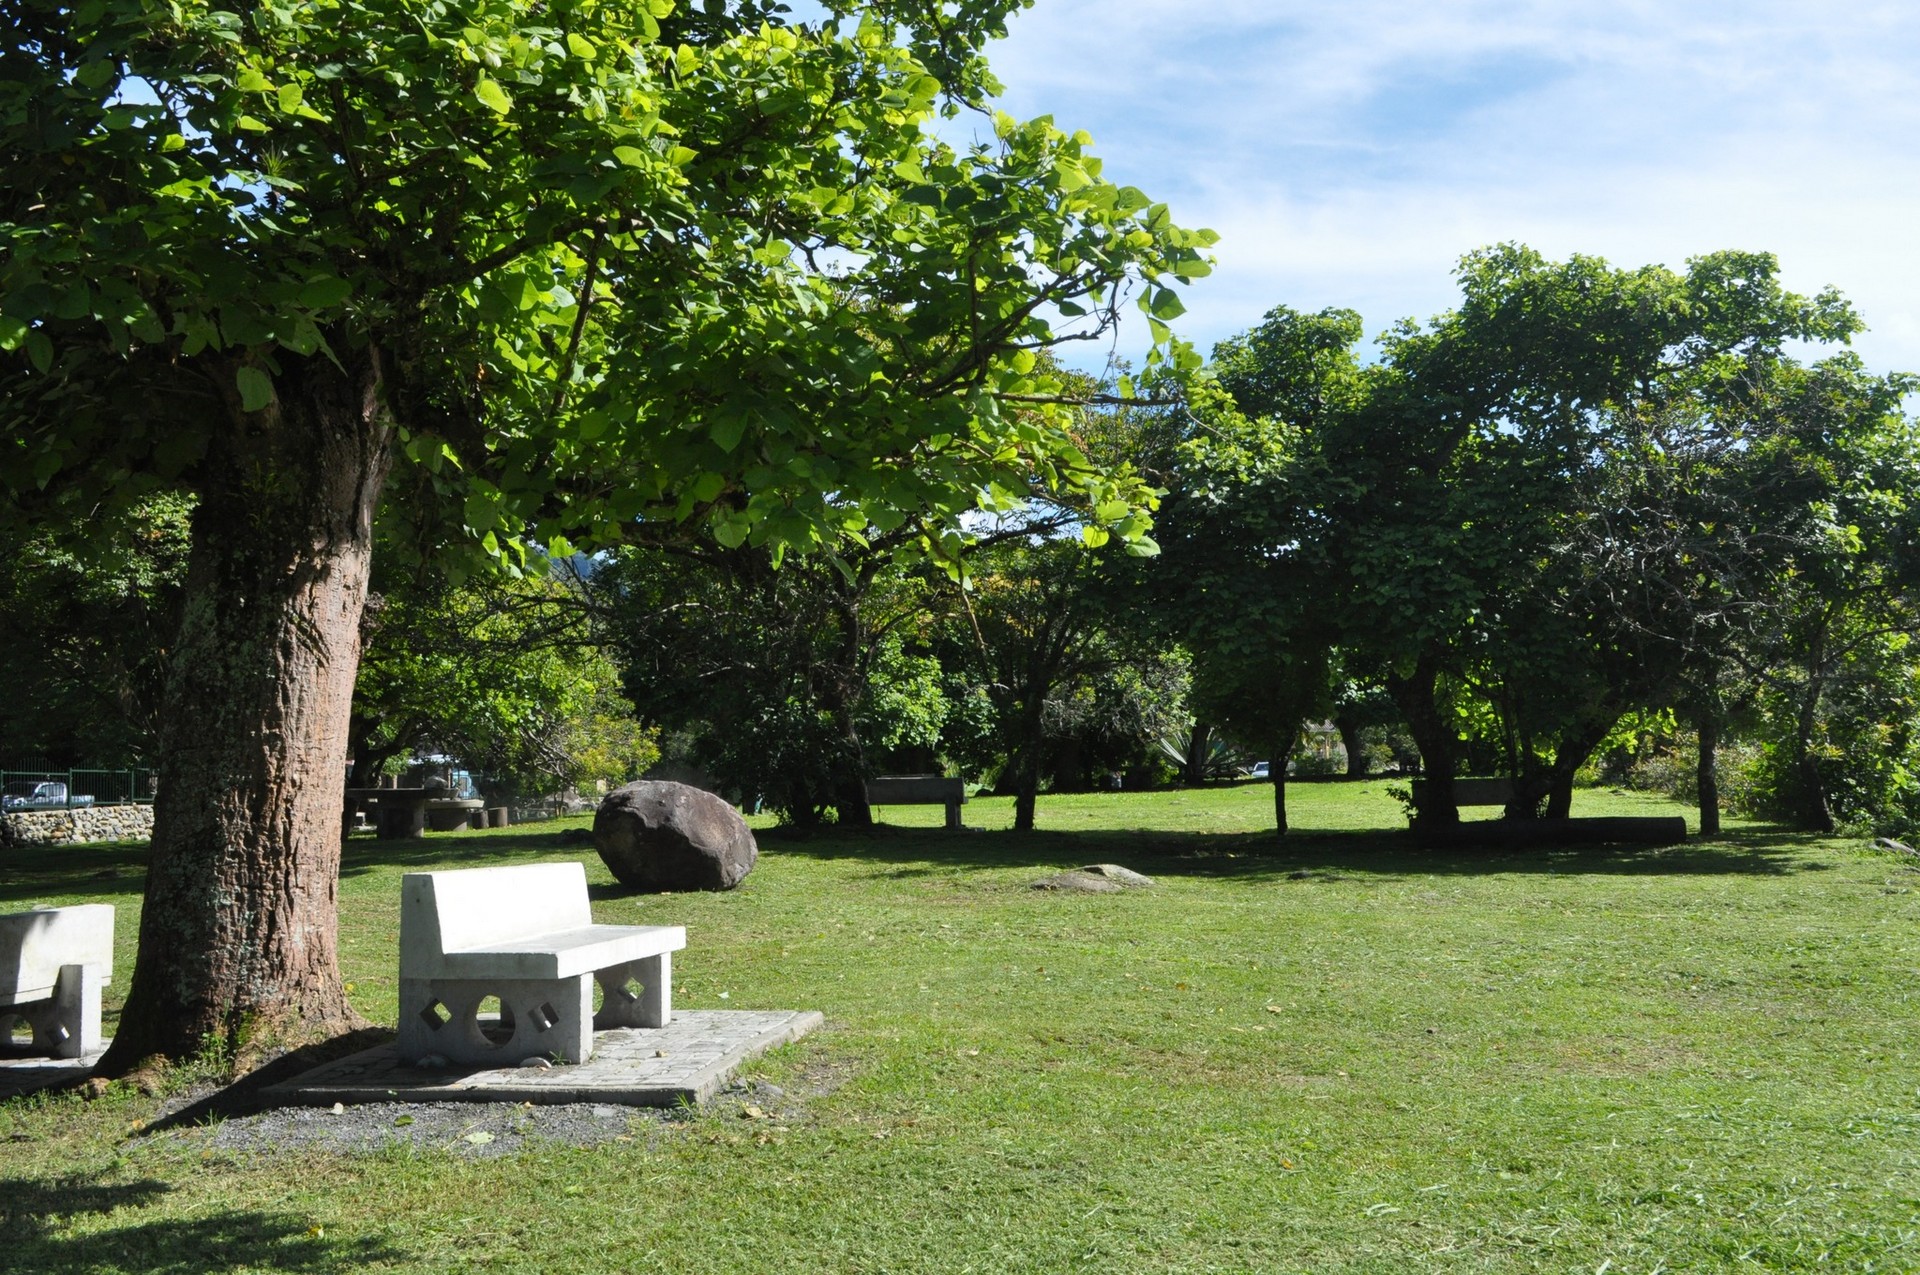
6. Relaxation and Wellness: Boquete
offers a tranquil and laid-back atmosphere, making it an ideal destination for
relaxation and rejuvenation. The town has several spas and wellness retreats
where visitors can indulge in massages, hot springs, and holistic treatments.
The peaceful surroundings and stunning mountain views create a serene
environment for unwinding.
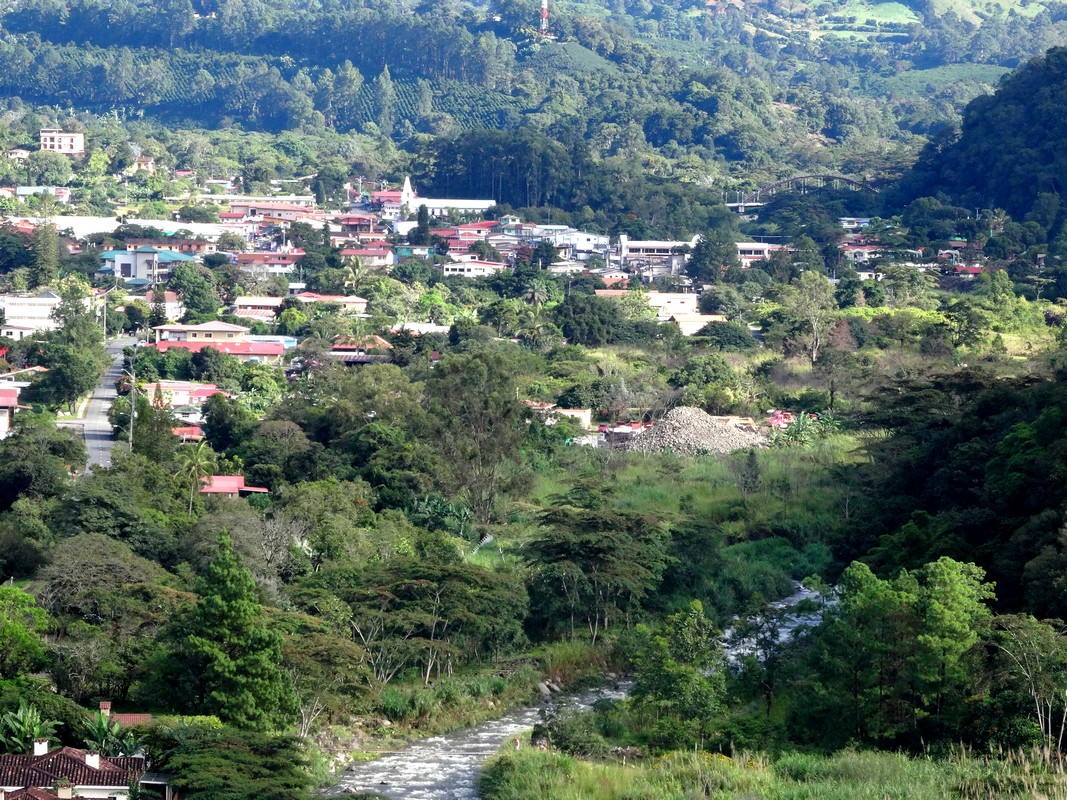
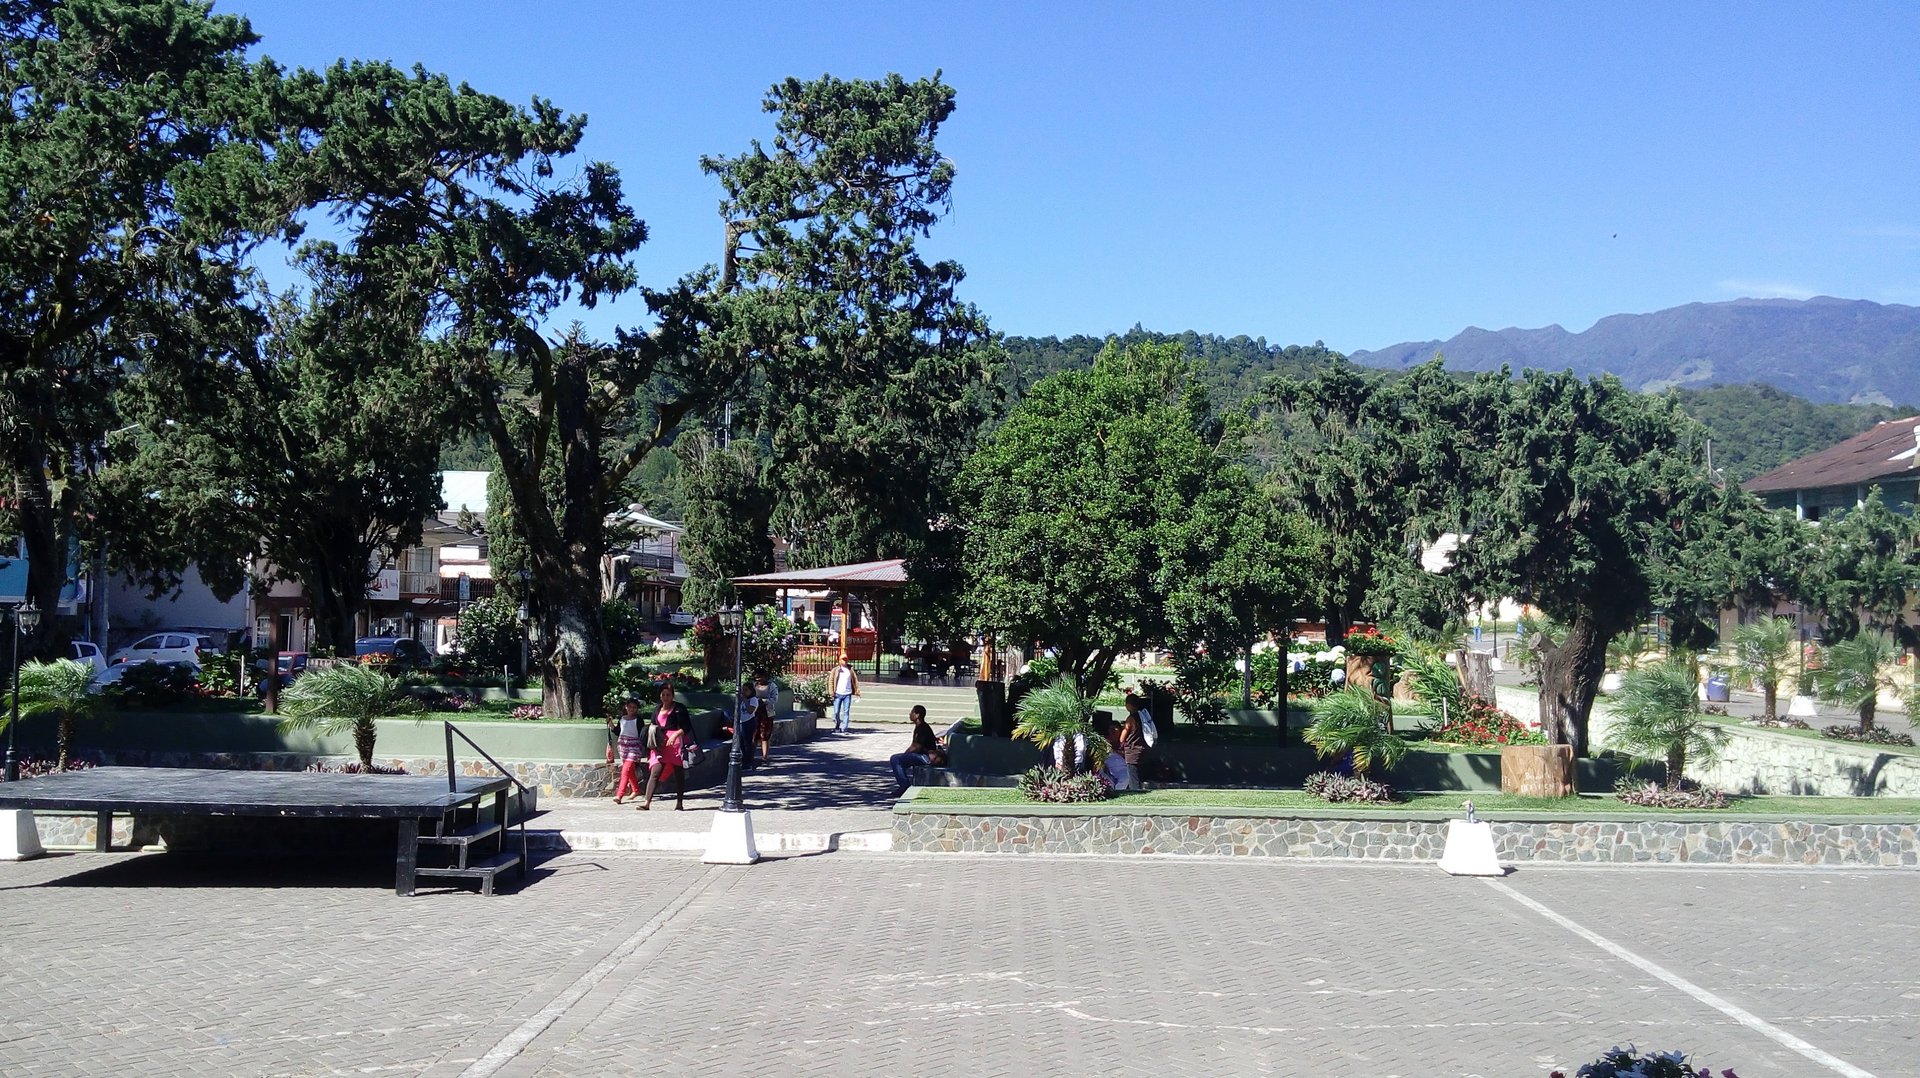
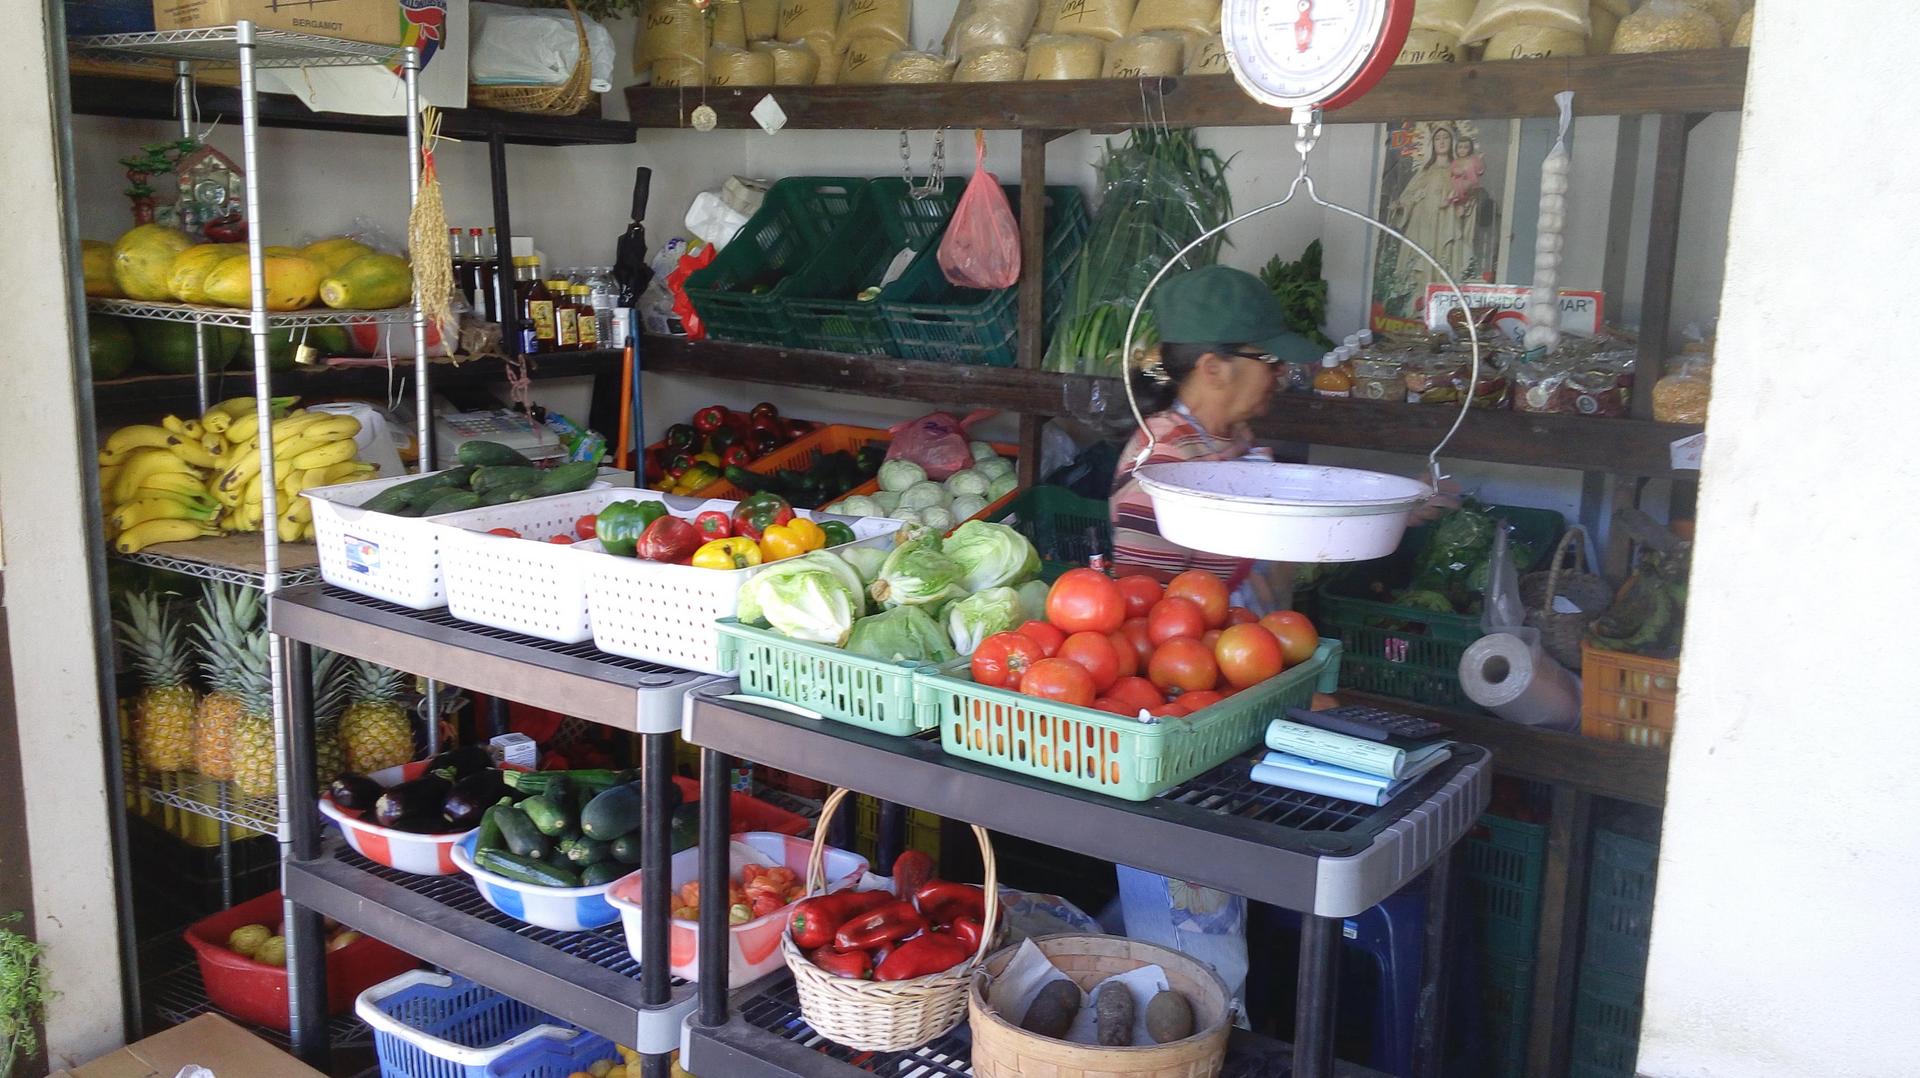
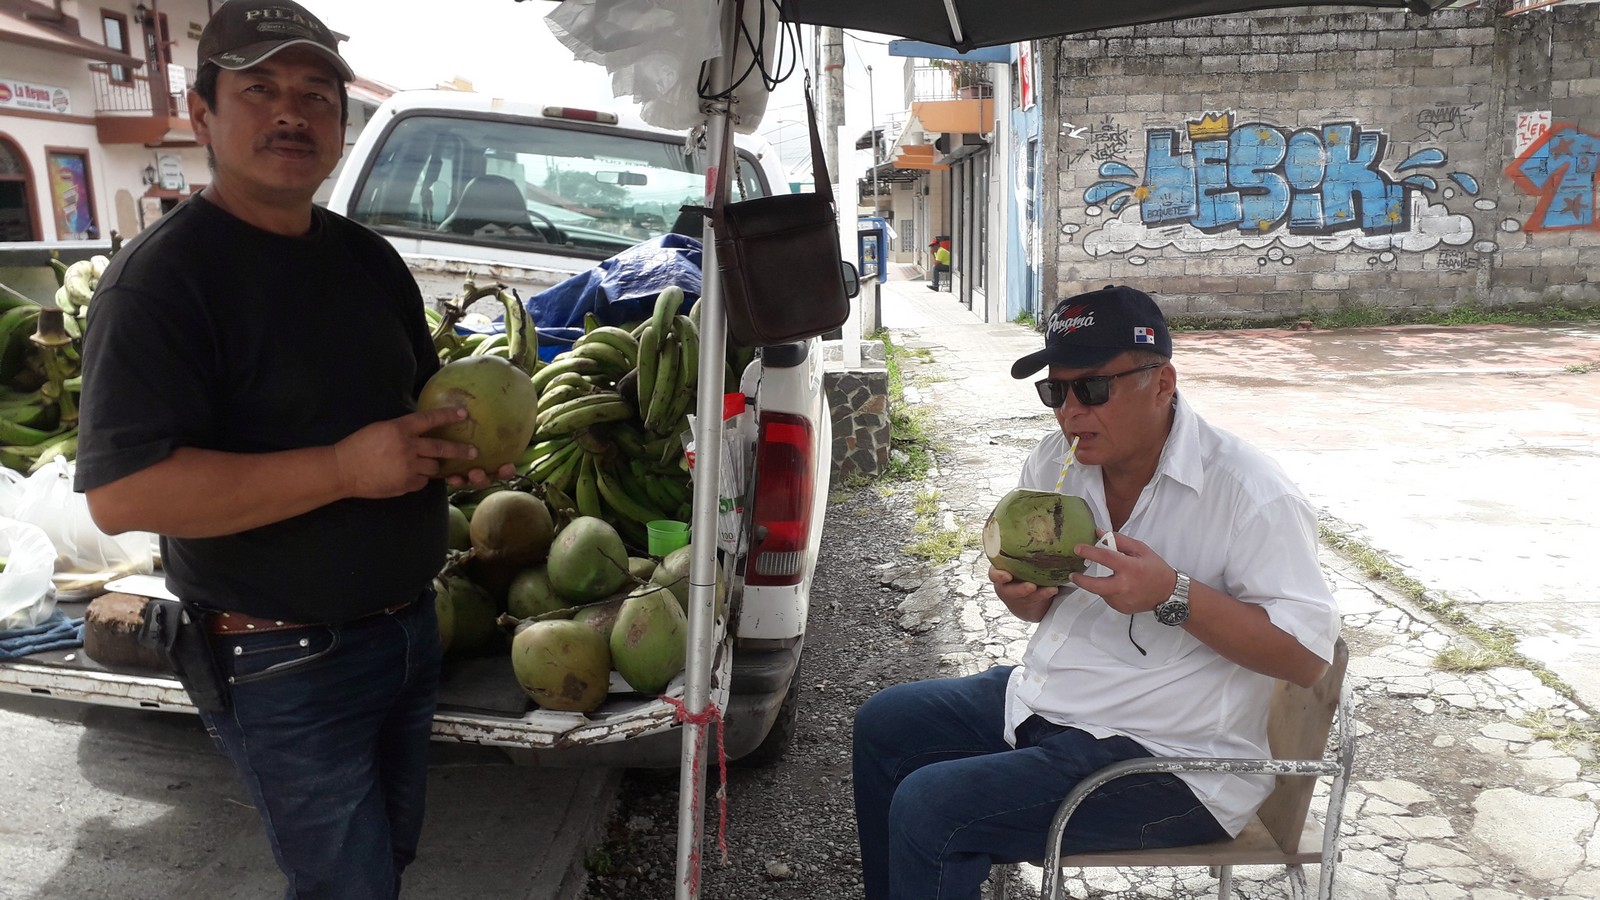
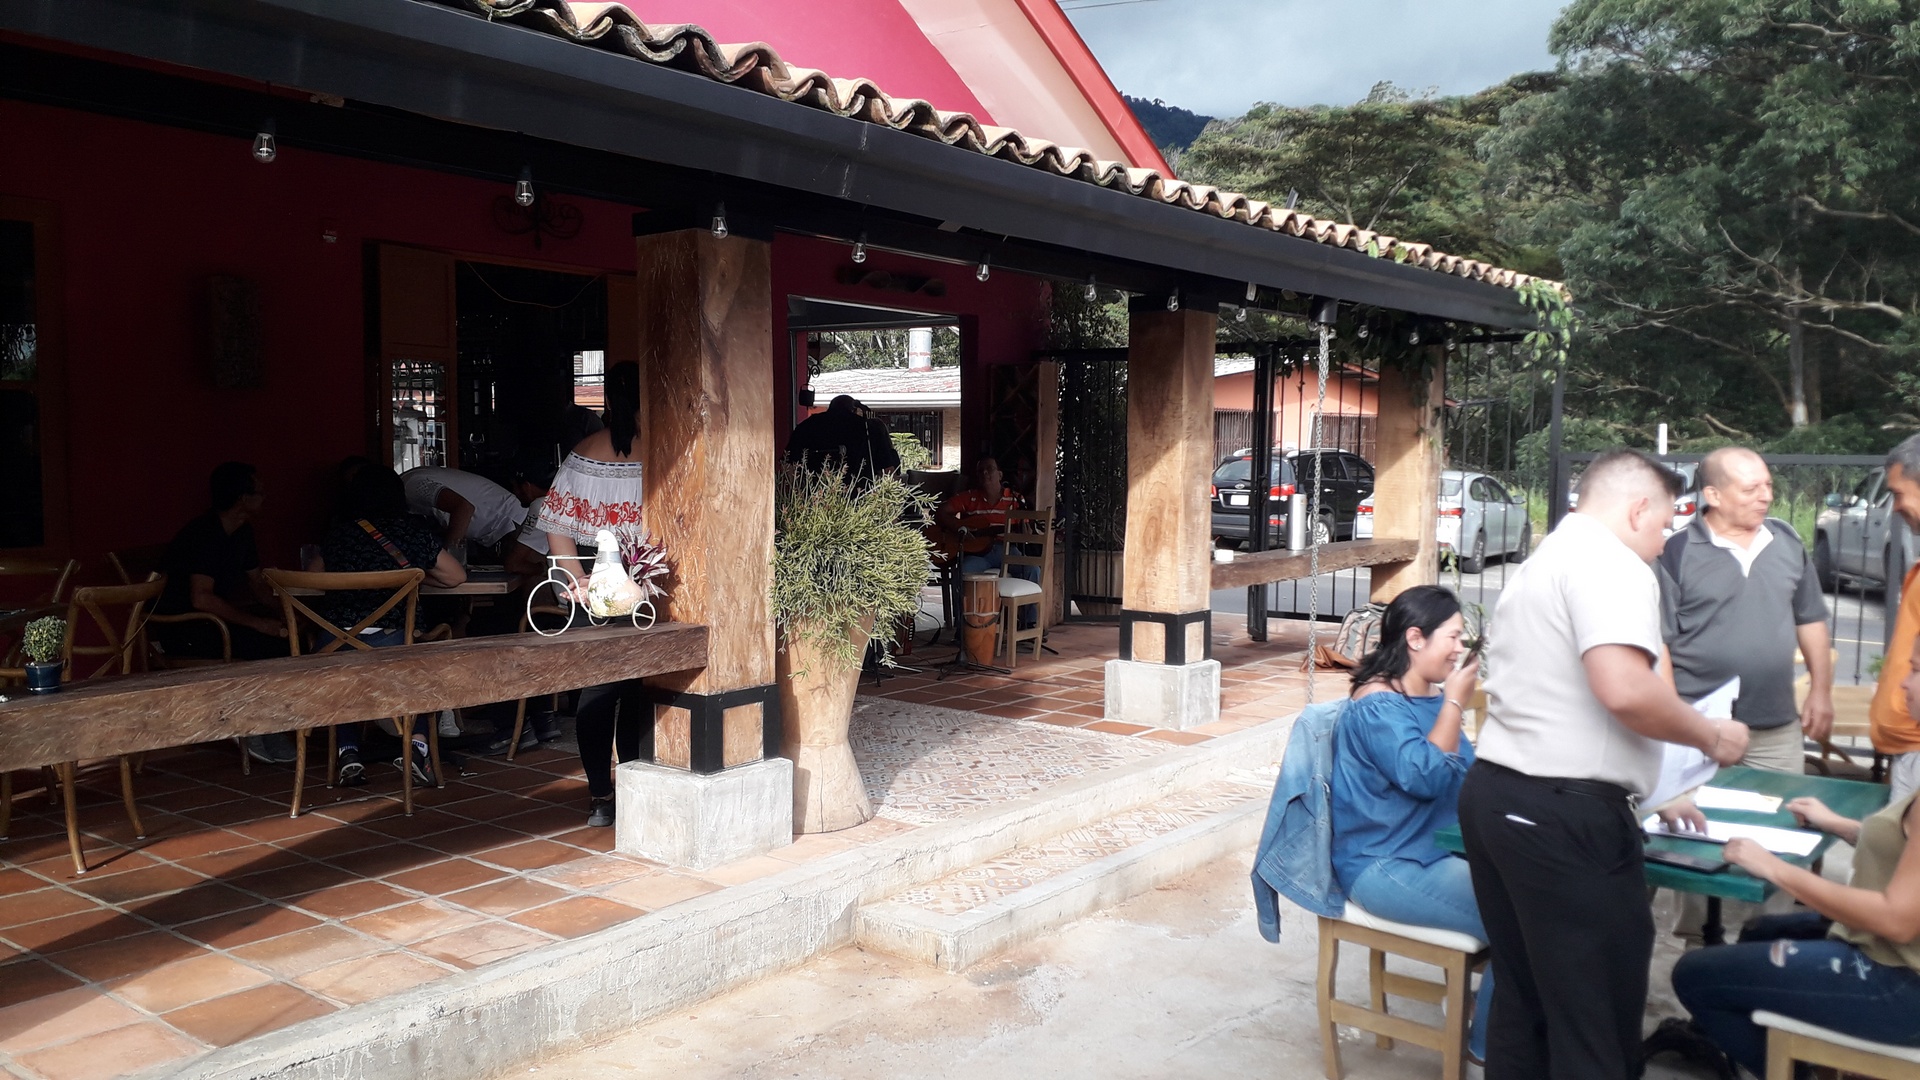
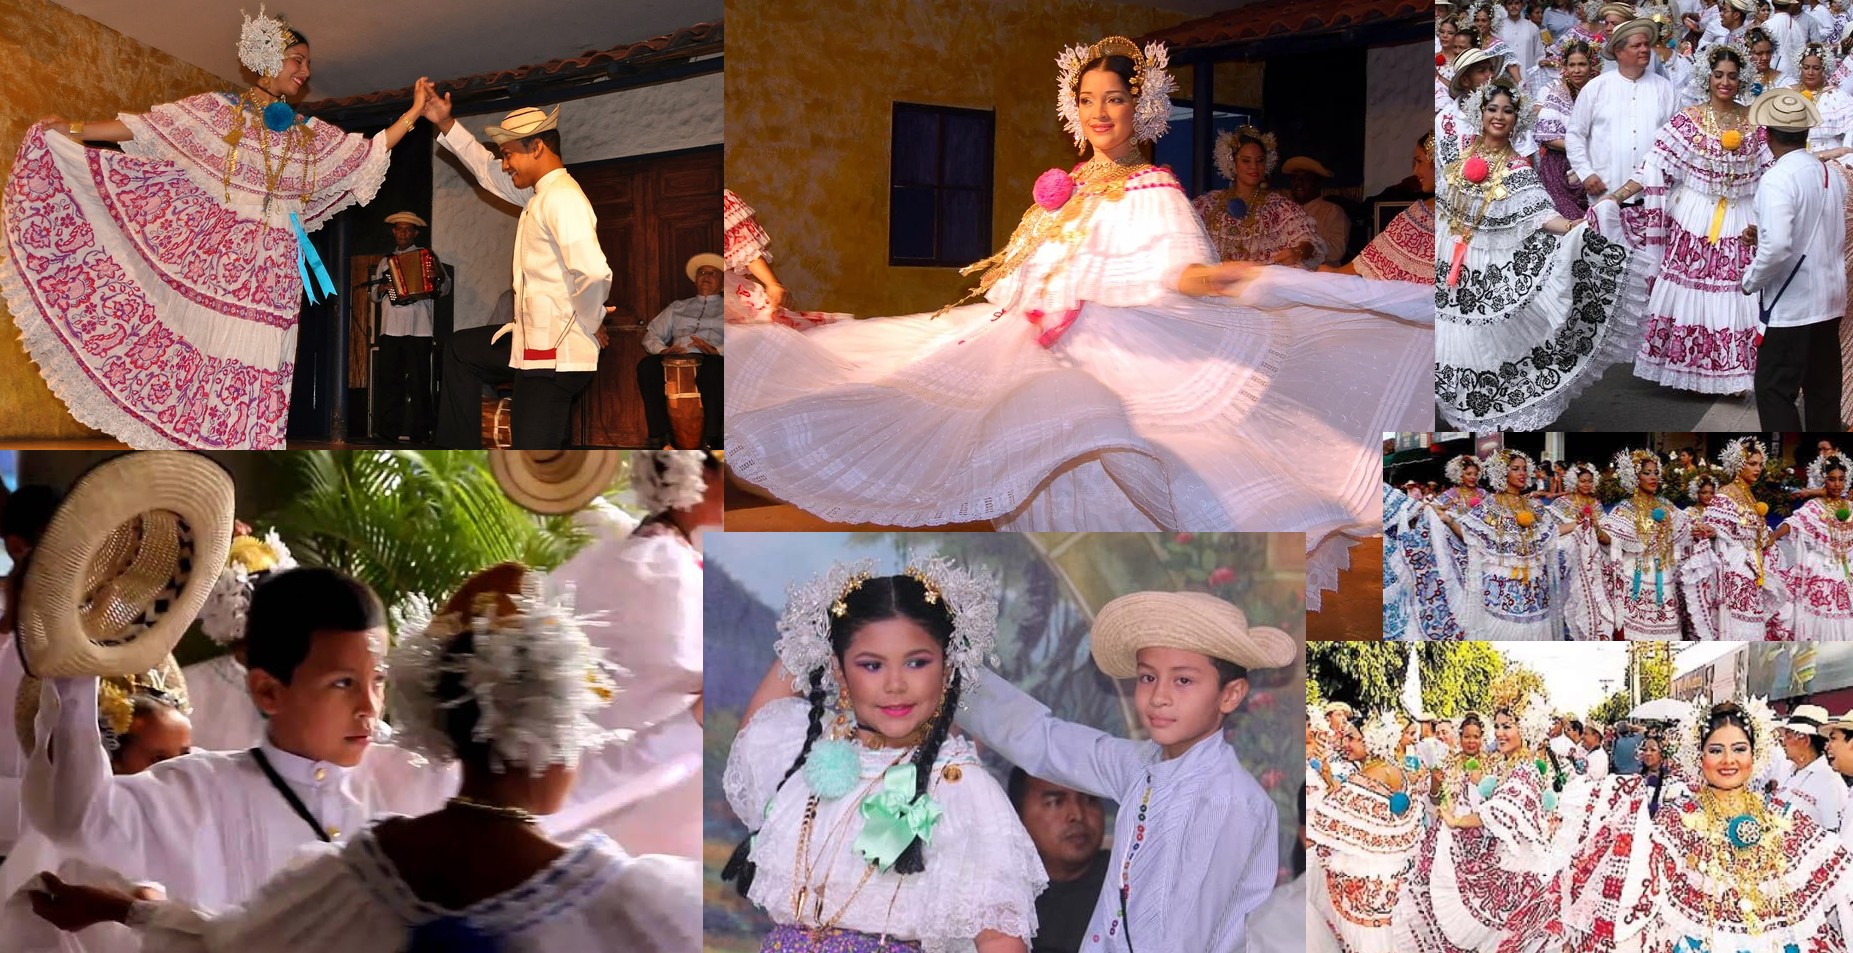
7. Quaint Town and Cultural Experience:
Boquete itself is a charming town with a welcoming community. Stroll through
its streets, visit local markets, and experience the warm hospitality of the
Panamanian people. The town has a vibrant arts and crafts scene, with artisans
showcasing their work. Don't miss the opportunity to savor delicious Panamanian
cuisine and local delicacies.
|
David Climate Data for 30 years (95 feet / 30m
above sea level)
|
||||||||||||||||||||||||||||||||||||||||||||||||||||||||||||||||||||||||||||||||||||||||||||||||||||||
|
(data from World
Meterological Organiation)
|
||||||||||||||||||||||||||||||||||||||||||||||||||||||||||||||||||||||||||||||||||||||||||||||||||||||
|
||||||||||||||||||||||||||||||||||||||||||||||||||||||||||||||||||||||||||||||||||||||||||||||||||||||
|
Los Naranjos
(Bajo Boquete) Climate Data for 9 years
(3,937 feet / 1.200 m above sea level) (data from worldclimate.com) |
||||||||||||||||||||||||||||||||||||||||||||||||||||||||||||
|
||||||||||||||||||||||||||||||||||||||||||||||||||||||||||||
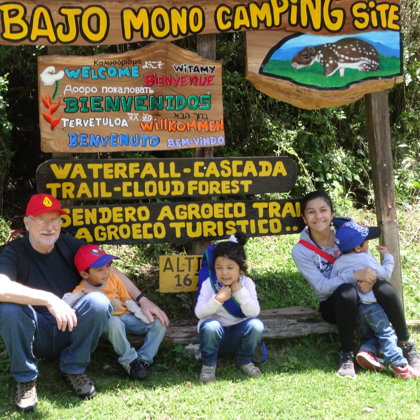
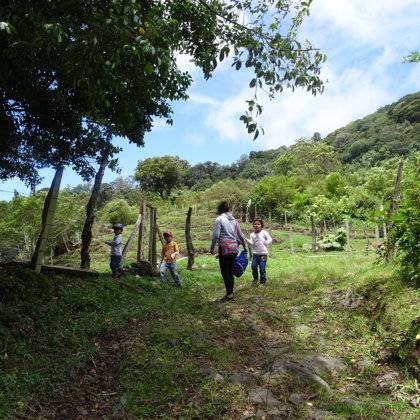
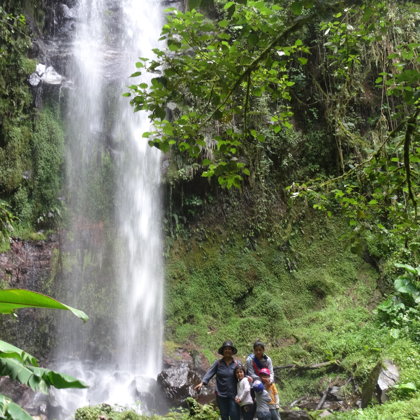
The Cascade of Bajo Mono Campingsite - Video
A beautiful stroll through green fields and woods to an impressing cascade where you can even take a bath in a small lake at its foot
La Cascada Escondida - Video
Las Cascadas Perdidas - Video
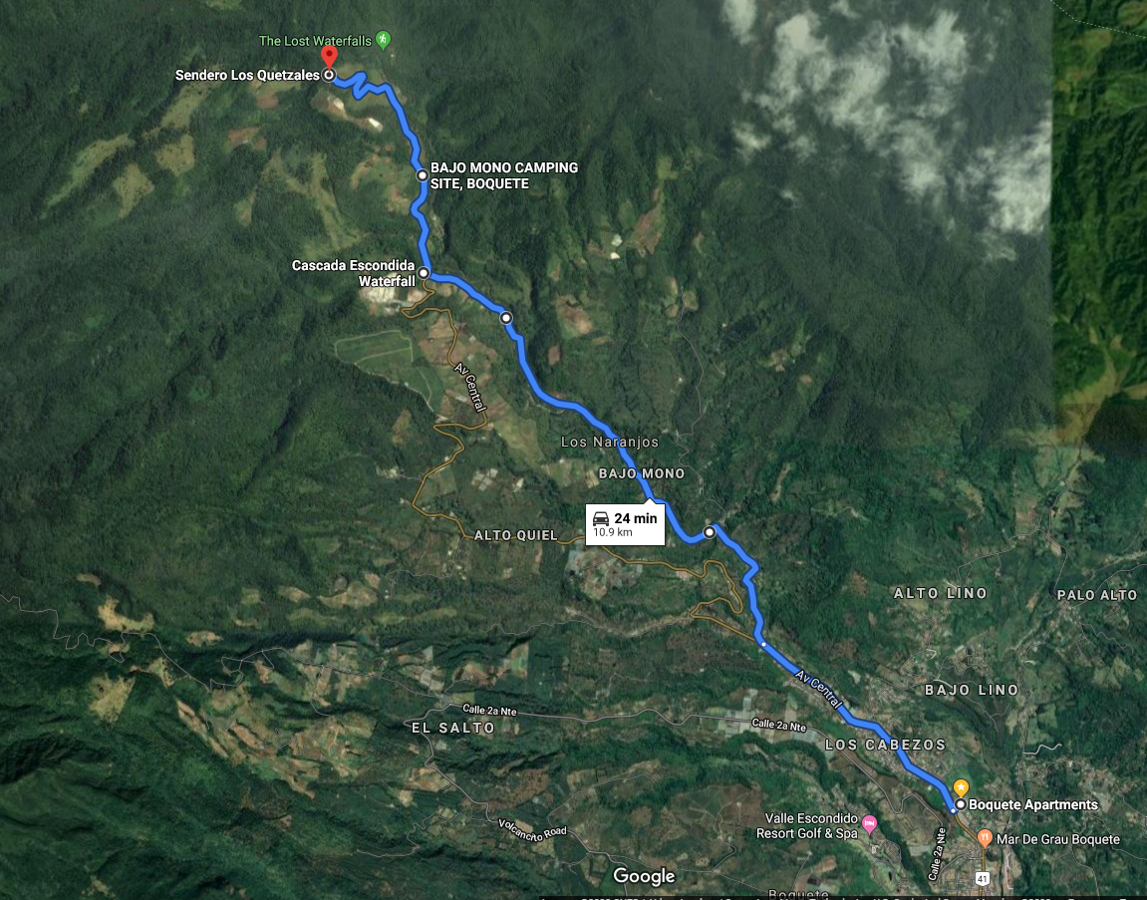
Click here to use Google Maps
If you use Waze, look for "Lost Waterfalls"
How to arrive at the most beautiful cascades of Boquete
From the Aparthotel Boquete, turn right onto Avenida Central towards Los Naranjos. The path forks at Los Naranjos, continue to the right and continue along this path without turning aside.
After about 100 m, you will see a rock face on the left side, which is often used for climbing. Shortly after, you will pass over a bridge over the Caldera River. Continue following the road, the river is on your left. After a few kilometres, the road crosses the river again after turning left.
After that, look for the signs that announce "Bajo Mono Camping Site". You can park your vehicle there. The campsite owners will then show you how to get to the waterfall on foot.
From here you can reach other waterfalls.
Continue on this road in the original direction. Eventually you will come to another detour to the left where the "Sendero de los Quetzales" is signposted. Here turn right onto a narrower paved road and follow it to the end. There you will park your vehicle and register with the local forest officials who will tell you where to proceed to reach the "Lost Waterfall".